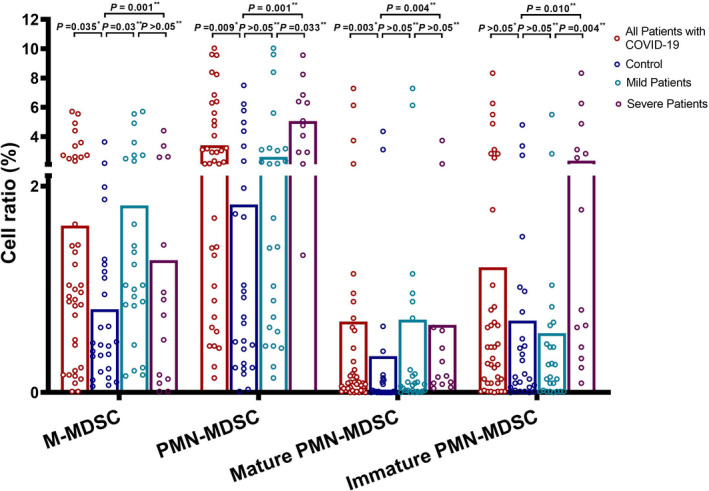
FIGURE 3.

Comparison of M‐MDSC, PMN‐MDSC and PMN‐MDSC subsets between the study groups. The data were assessed statistically using the *Mann‐Whitney U test and the **Kruskal‐Wallis test. M‐MDSCs, monocytic myeloid‐derived suppressor cells; MDSCs, Myeloid‐derived suppressor cells; PMN‐MDSCs, polymorphonuclear myeloid‐derived suppressor cells
