
Figure EV1. Uneven distribution of naturally occurring mutants in RBD.
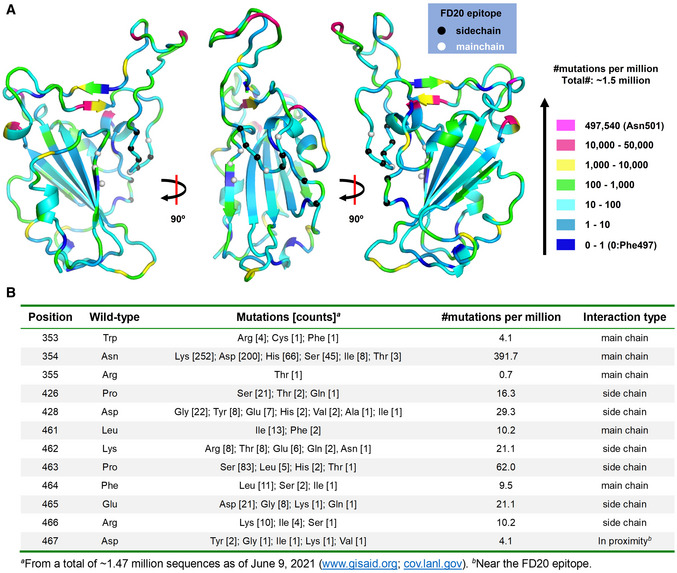
- The distribution of naturally occurring mutants in RBD viewed at different angles. Residues are color‐coded according to their mutation frequency using the color scheme on the right. The FD20 epitopes are labeled as Cα spheres which are color‐coded based on their interaction type with FD20 (by side chain or by the main chain).
- Details of the mutations of the FD20 epitope residues.