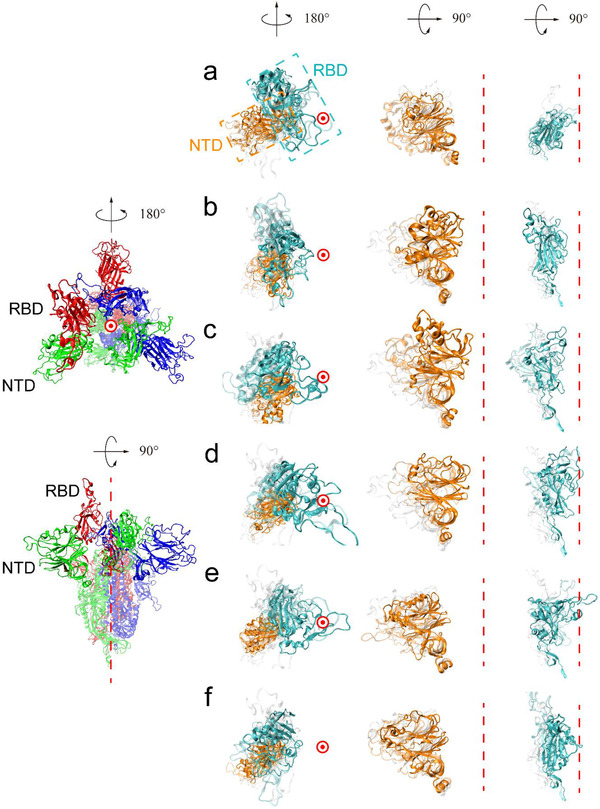
Figure 1.

Top view (left) and side view (right) of the initial and final structures of the four simulation systems. The leftmost column is a structural illustration of S protein. Here, the partially open structure is chosen for demonstration, with three chains highlighted in red, green, and blue, respectively. To assist visualization, the RTD and NTD in each chain are shown in the opaque mode while the remaining parts are shown in the transparent mode. a–f) Comparison of the initial and final structures in all simulation systems. The RBD of interest and its partner NTD are shown in the second column with the top view. The NTD and RBD are enlarged and shown in the following two columns with the side view. The central axis is represented by a red dashed line in the side view and a red circle in the top view. The initial structures are colored gray in the transparent mode. In the final structure, the RBDs are colored cyan and the NTDs are colored orange. The intermediate states are shown in the transparent mode with the RBDs colored cyan and the NTDs colored orange. In the closed system (a) all RBDs are locked in the downward orientation. In the partially open system (b), semi‐open system (c), and open system (d), the tendency of the upward RBD to tilt downward is prohibited by the neighboring NTD moving toward the central axis. e,f) In the semi‐open system (e) and the open system (f), the upward RBD reorients to the downward orientation when the NTD swings away from the central axis and then moves back.
