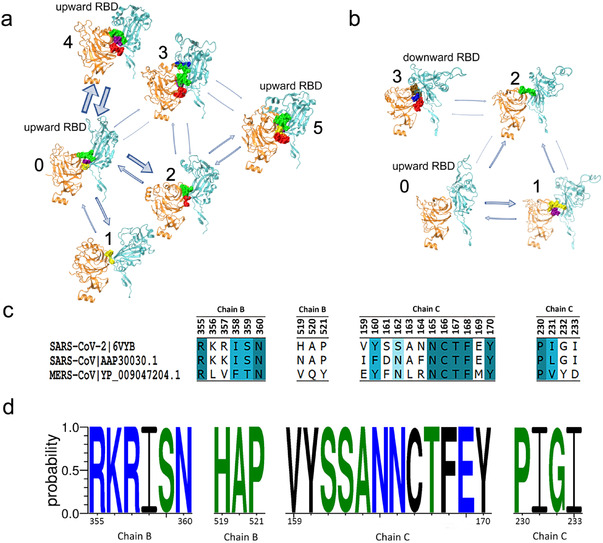
Figure 4.

Key residue pairs identified at the interacting interface between the NTD and corresponding RBD during the transition process. a) Key residue pairs of each macrostate in MSM for the mode characterized by NTD wedging in and RBD being blocked. Spatially neighboring residue pairs form a clump and different clumps are marked with different colors (see Table S2, Supporting Information, for more details). b) Key residue pairs of each macrostate in MSM for the mode characterized by NTD moving out and RBD tilting downward (see Table S3, Supporting Information, for more details). c) Evolutional analysis of key residue pairs in (a) among SARS‐CoV‐2 (PDB ID:6VYB),[ 9 ] SARS‐CoV (GenBank: AY278488.2),[ 48 ] and MERS‐CoV (GenBank: NC_01 9843.3).[ 49 ] Results were visualized by Discovery Studio Visualizer.[ 50 ] d) Evolutional analysis of key residue pairs in (a) among all samples of COVID‐19 patients from GISAID.[ 51 , 52 ] Data were collected on September 28th, 2020. Results were visualized by WebLogo.[ 53 , 54 ] Hydrophilic, neutral and hydrophobic residues are colored in blue, green, and black, respectively.
