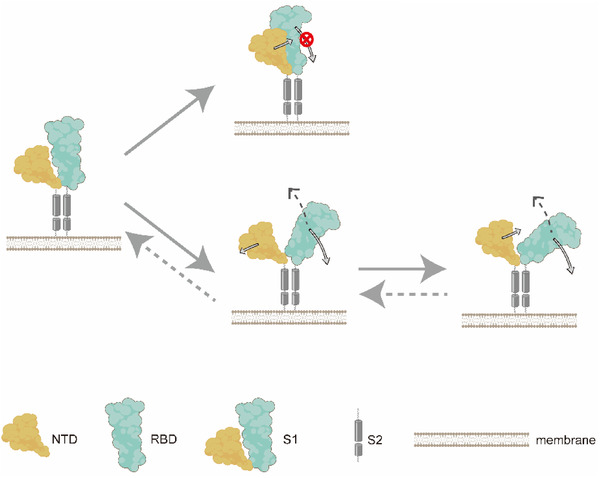
Figure 5.

The schematic diagram for the NTD “wedge” effect in controlling conformational changes of the S protein. The leftmost structure is the simplified initial conformation, where only one NTD (orange) and its neighboring RBD (cyan) are showed in this sketch. When the NTD wedges in and favorably interacts with the RBD, the free tilting of the RBD is blocked and the S protein is locked into individual conformation states. Occasionally, when the NTD swings out and detaches from the RBD, the RBD's reorientation is restored, thus enabling the interstate transition of the S protein. Hypothetically, the opposite motion of the RBD tilting upward may occur during the activation of the S protein, which is illustrated by dotted arrows.
