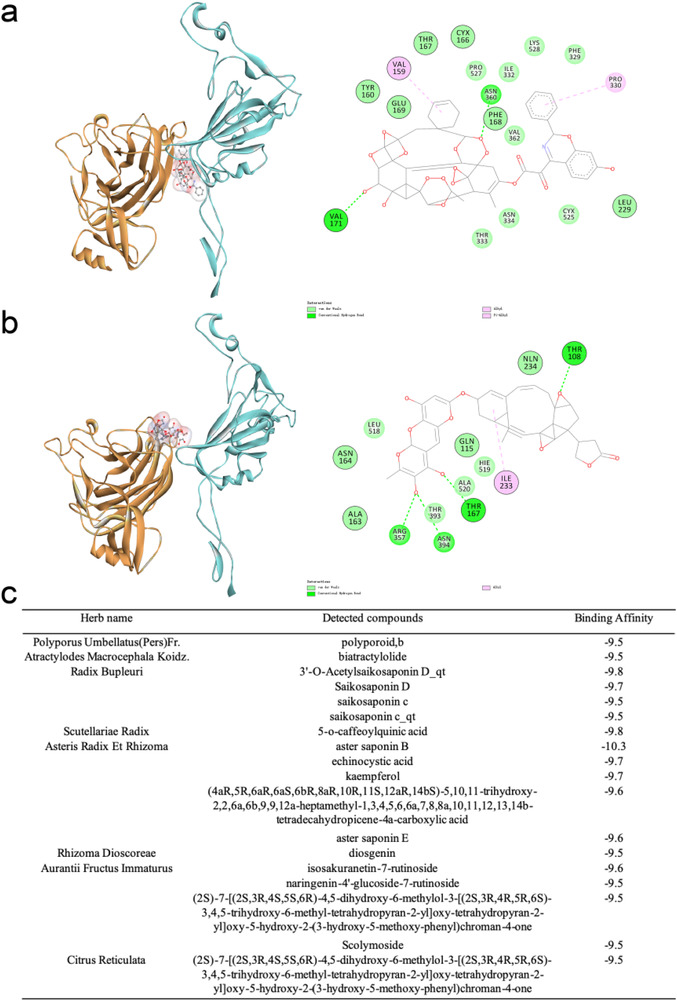
Figure 6.

Case study of virtual screening by docking. a,b) Top compounds, ZINC000261494659 (a) and ZINC000256109538 (b) from ZINC15 database are identified with high binding affinities to the NTD–RBD interface in the partially open system. In the left column, the NTD of chain C is colored orange and the upward RBD of chain B is colored cyan. The drug compounds are represented with the ball‐and‐stick model. In the right column, detailed interactions between the compounds and the NTD–RBD interface are visualized using Discovery Studio Visualizer. Residues in chain C are highlighted with a black circle. c) Compounds from the TCMSP database with high binding affinities are detected in the traditional Chinese prescription “Qing Fei Pai Du Tang.”
