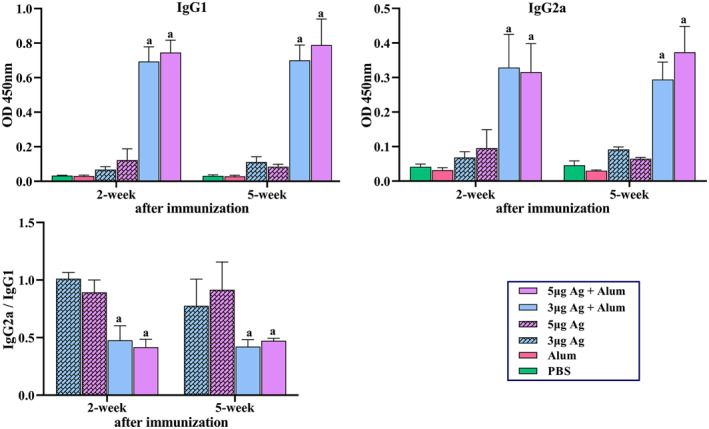
FIGURE 5.

Measurement of specific IgG1, IgG2a antibodies and IgG2a/IgG1 ratio in mice groups that received different vaccine preparations. Immunisations were carried out two times during 2 weeks with 100 μL intramuscular injection of different vaccine preparations according to Table 1. A PBS solution containing 3 or 5 μg of purified inactivated viruses as antigens, administered alone or in combination with alum. The control groups received alum or PBS. The mice were bled at 2 and 5 weeks post‐immunisation, and individual sera were assayed by ELISA. (a) Anti‐COV IgG1. (b) IgG2a antibody titres in 1/1000 dilutions of serum at 2 and 5 weeks post‐immunisation. (c) IgG2a/IgG1 ratio. Data are mean ± SD. The levels of statistical significance for differences between test groups were determined using two‐way ANOVA followed by Tukey’s post hoc test. (a) Statistical significance (P < 0.01) in comparison with groups that received 3 or 5 μg antigen alone
