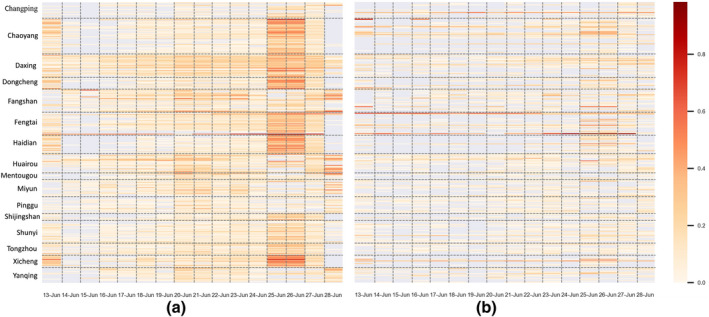
FIGURE 3.

Quantification of human mobility restrictions: (a) human mobility reduction rate entering and leaving the sub‐districts; (b) intra‐sub‐district mobility reduction rate

Quantification of human mobility restrictions: (a) human mobility reduction rate entering and leaving the sub‐districts; (b) intra‐sub‐district mobility reduction rate