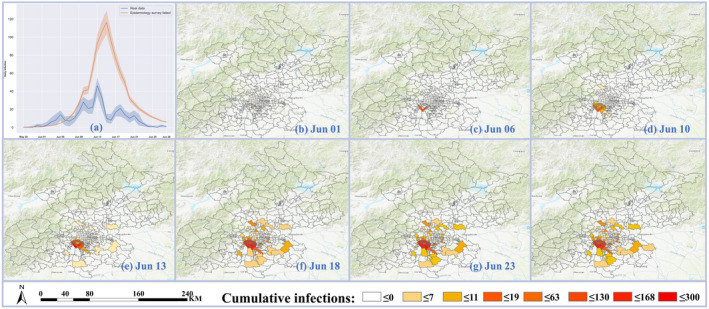
FIGURE 9.

Failed epidemiology survey scenario: (a) daily new infection curves of the failed epidemiology survey scenario and reality; and (b–h) distribution of cumulative infections in Beijing at different periods under the failed epidemiology survey scenario
