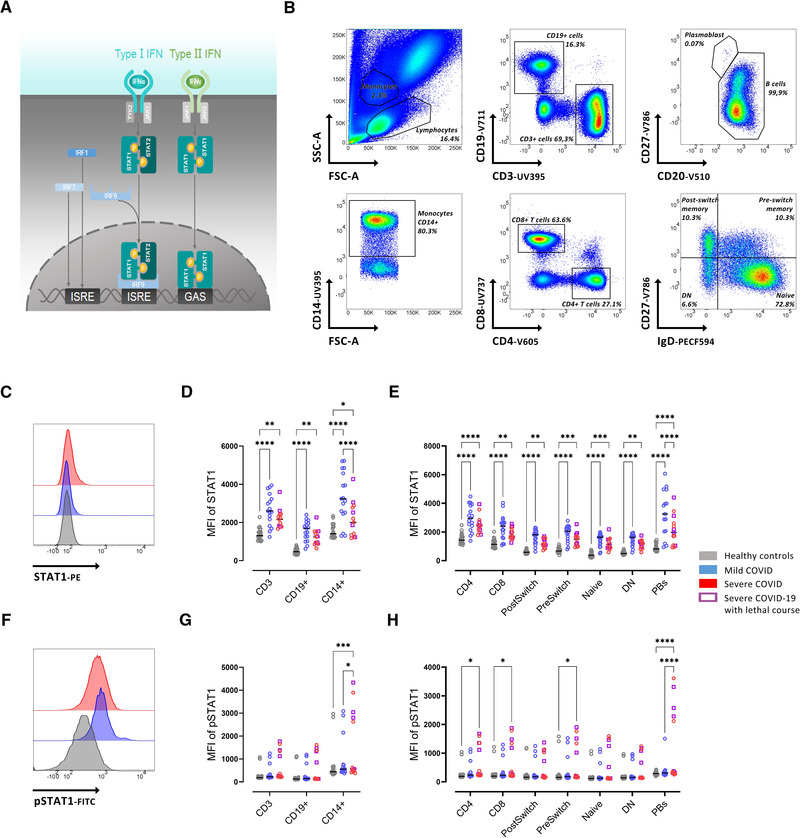
Figure 1.

Reduced STAT1 expression in severe COVID‐19 patients. (A) Schematic depiction of JAK/STAT signaling. (B) Gating strategy on whole blood flow cytometry for IgD+CD27‐ (Naïve), IgD+CD27+ (PreSwitch), IgD‐CD27+ (PostSwitched), and IgD‐CD27‐ (Double Negative, DN) as well as CD4+ and CD8+ T cells. (C) Representative histograms of baseline expression of STAT1 on B cells from healthy controls (grey), mild (blue), and severe (red) COVID‐19 patients. (D) Median fluorescence intensity (MFI) of STAT1 in CD3+, CD19+, and CD14+ cells. (E) MFI of STAT1 in T‐ and B‐ cell subsets (as described in B). (F) Representative histograms of baseline expression of pSTAT1 on B cells from healthy controls (grey), mild (blue), and severe (red) COVID‐19 patients. (G) MFI of STAT1 in CD3+, CD19+, and CD14+ cells. (H) MFI of pSTAT1 in T‐ and B‐cell subsets (as described in B). Median and data from healthy controls (n = 20), mild COVID‐19 (n = 17), and severe COVID‐19 (n = 13) patients. (B‐H) Data shown are representative from nine independent experiments. Two‐way ANOVA with Sidack post‐test. *p < 0.05, **p < 0.01, ***p < 0.001, and ****p < 0.0001. Deceased patients are indicated as purple quadrats
