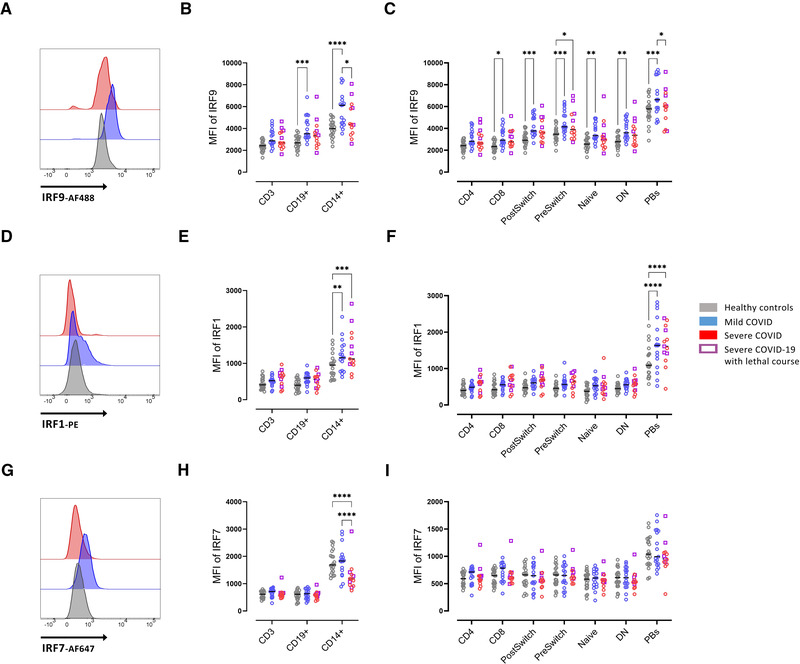
Figure 2.

Enhanced intracellular IRF9 expression in severe COVID‐19. (A) Representative histograms of baseline expression of IRF9 on B cells from healthy controls (grey), mild (blue), and severe (red) COVID‐19 patients. (B) Median fluorescence intensity (MFI) of IRF9 in CD3+, CD19+, and CD14+ cells. (C) MFI of IRF9 in T‐ and B‐cell subsets (as described in Fig. 1B). (D) Representative histograms of baseline expression of IRF1 on B cells healthy controls (grey), mild (blue) and severe (red) COVID‐19 patients. (E) MFI of IRF1 in CD3+, CD19+, and CD14+ cells. (F) MFI of IRF1 in T‐ and B‐cell subsets (as described in Fig. 1B). (G) Representative histograms of baseline expression of IRF7 on B cells from healthy controls (grey), mild (blue), and severe (red) COVID‐19 patients. (H) MFI of IRF7 in CD3+, CD19+, and CD14+ cells. (I) MFI of IRF7 in T‐ and B‐cell subsets (as described in Fig. 1B). Median and data from healthy controls (n = 20), mild COVID‐19 (n = 17), and severe COVID‐19 (n = 13) patients. (A‐I) Data shown are representative from nine independent experiments. Two‐way ANOVA with Sidack post‐test. *p < 0.05, **p < 0.01, ***p < 0.001, and ****p < 0.0001. Deceased patients are indicated as purple quadrats
