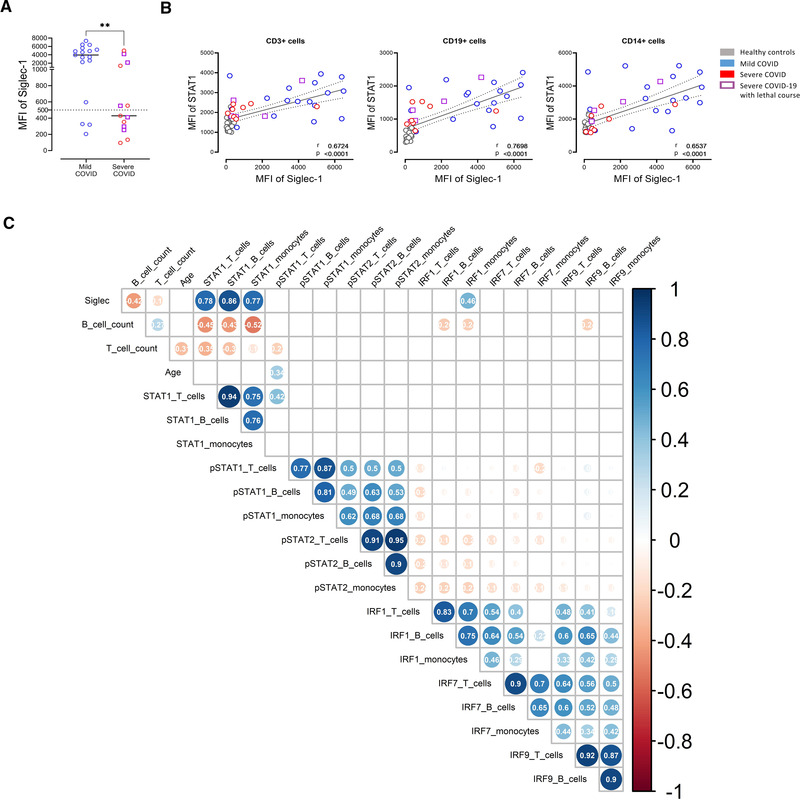
Figure 3.

Significant correlation of STAT1 and Siglec‐1 (CD169). (A) Siglec‐1 (CD169) expression on CD14+ monocytes in mild and severe COVID‐19 patients. (B) Correlation of Siglec‐1 expression on the surface of CD14+ monocytes with intracellular STAT1 expression in CD3+ T cells, CD19+ B cells, or CD14 + monocytes. Each point represents a donor. Mann–Whitney U test. *p < 0.05, **p < 0.01. (C) Spearman´s correlation matrix showing the correlation of all investigated parameters (STAT1, pSTAT1, pSTAT2, IRF1, IRF7, and IRF9) in relation to the analyzed cell populations (B cells, T cells, and monocytes). Corresponding correlations are represented by red (negative) or blue (positive) circles. Size and intensity of color refer to the strength of correlation. Data from healthy controls (n = 20), mild COVID‐19 (n = 17), and severe COVID‐19 (n = 13) patients. (A‐C) Data shown are representative from nine independent experiments. Only correlations with p ≤ 0.05 are indicated. Deceased patients are indicated as purple quadrats
