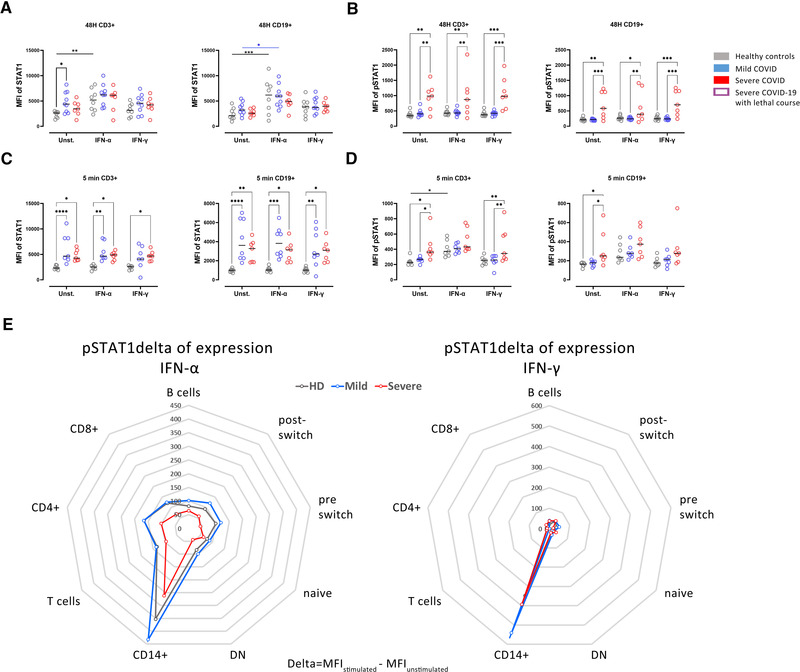
Figure 4.

Attenuated pSTAT1 response upon IFN type I and II stimulation in severe COVID‐19. (A) STAT1 and (B) pSTAT1 expression in CD3+ T cells and CD19+ B cells in culture of PBMCs from healthy controls (grey, n = 8), mild (blue, n = 9), or severe (red, n = 7) COVID‐19 patients. Cells were stimulated for 48 h with either IFN‐α (5 ng/mL) or IFN‐γ (5 ng/mL), or only RPMI as a control. (C) STAT1 and (D) pSTAT1 expression in PBMCs of the same donors as in (A) stimulated with IFN‐α (100 ng/mL) or IFN‐γ (100 ng/mL) for 5 min. (E) Delta of pSTAT1 expression in cell populations after stimulation with IFN‐α (left) or IFN‐γ (right) for 5 min in the three study groups. Untreated control values of pSTAT1 were subtracted to show the individual increase of STAT1 phosphorylation. Data are presented as radar diagrams. Two‐way ANOVA with Sidack post‐test. *p < 0.05, **p < 0.01, ***p < 0.001, and ****p < 0.0001
