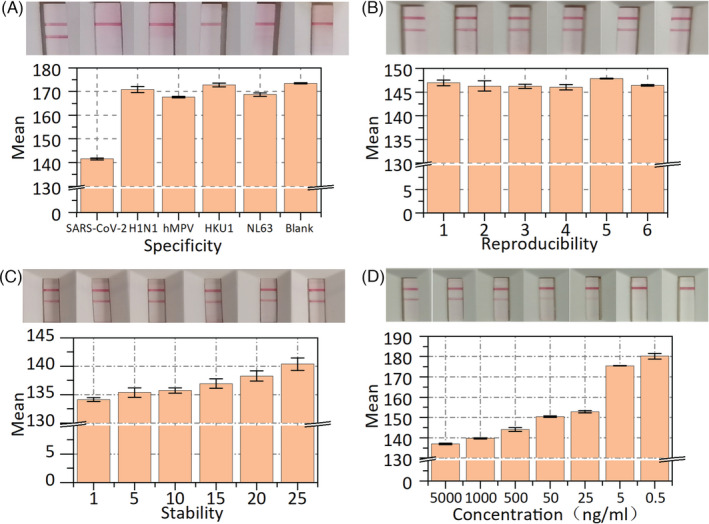
FIGURE 5.

The specificity, reproducibility, stability, and sensitivity analysis of the LFIA. (A) Mean gray value and test results of SARS‐CoV‐2 antigen, H1N1, hMPV, HKU1, NL63 and blank control. (B) Test results and mean gray value of reproducibility on the same batch of six strips. (C)Test results and mean gray value of stability on the same batch of six strips. (D) Test results and mean gray value of the sensitivity of the LFIA. Error bar represents the standard deviation of three repetitive experiments
