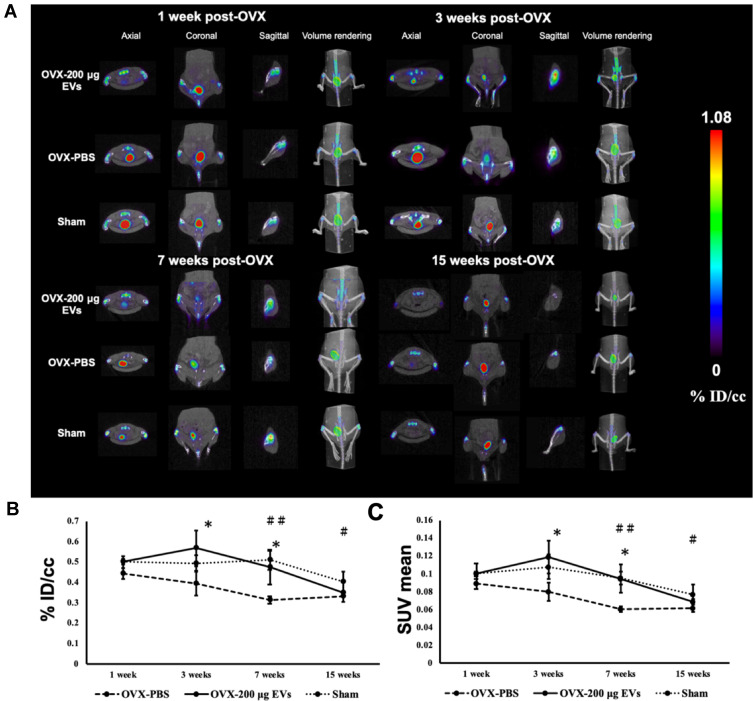
Figure 4.
Micro-PET/CT imaging and quantitative analysis of [18F]NaF. (A) Axial, coronal, sagittal, and volume rendering view of [18F]NaF tracer activity at the 1, 3, 7, and 15 weeks post OVX in OVX-200 μg EVs, OVX-PBS, and Sham groups. (B and C) Quantification of [18F]NaF uptake in distal femur using %ID/cc or SUVmean methods. Data are expressed as mean±SD (*p<0.05, #P<0.05 and ##P<0.01). *Indicate a significant difference between OVX-200 μg EVs and OVX-PBS. #Indicate significant differences from Sham and OVX-PBS groups.
Abbreviations: OVX, ovariectomy; PBS, phosphate buffered saline; PET, positron emission tomography; CT, computed tomography; SUV, standardized uptake values.

