Figure 6.
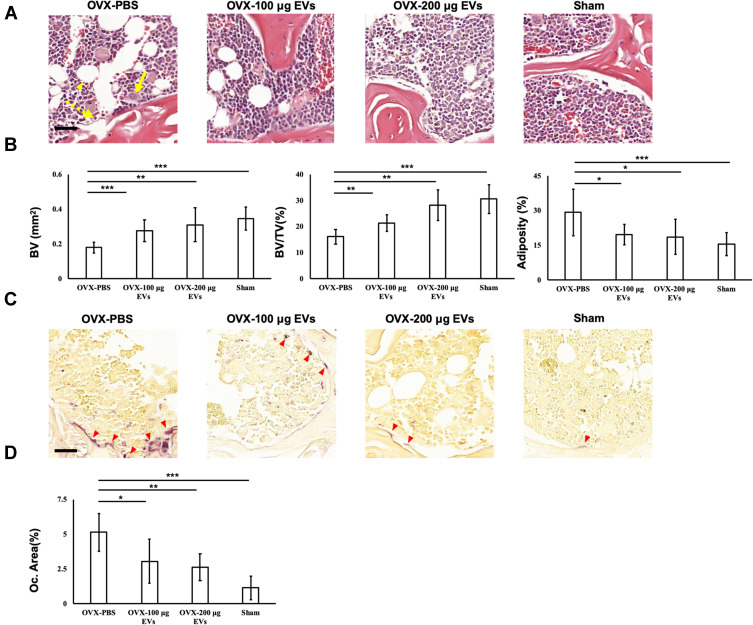
Histomorphometric analyses of skeletal tissues. (A) The images of H&E staining in OVX-PBS, OVX-100 μg EVs, OVX-200 μg EVs, and Sham groups. Yellow arrow, osteoclasts; dotted yellow arrow, osteoblasts; yellow arrowhead; lipids. (B) The value of BV and BV/TV, and adiposity were measured. (C) Staining of TRAP in OVX-PBS, OVX-100 μg EVs, OVX-200 μg EVs, and Sham groups. Red arrowhead, osteoclasts. (D) Quantification of osteoclasts area were analyzed. Data are expressed as mean±SD (*p<0.05, **p<0.01, ***p<0.005). Scale bar: 50 μm.
Abbreviations: BV/TC, bone volume fraction; EV, extracellular vesicles; H&E, hematoxylin and eosin; OVX, ovariectomized; EV, extracellular vesicles; TRAP, tartrate-resistant acid phosphatase.

