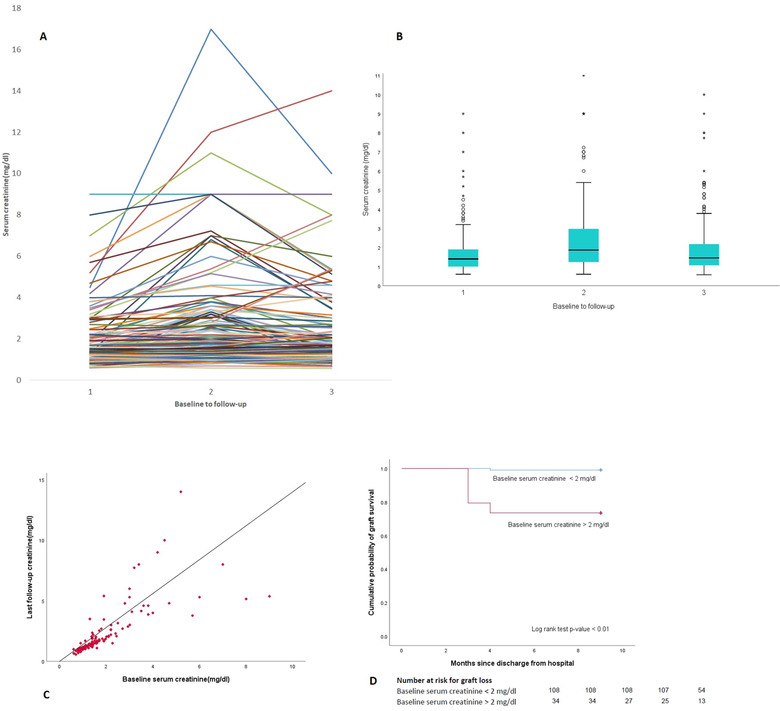
FIGURE 2.

(A) Spaghetti plot showing trend of serum creatinine of individual cases. The cases with incomplete recovery or non‐recovery of acute kidney injury had higher baseline serum creatinine. (B) Box and whisker plot showing the differences in median (IQR) serum creatinine levels with follow‐up. Note the median creatinine at follow‐up nearing baseline levels (x‐axis values in graphs (A) and (B) depict 1 as serum creatinine value prior to COVID‐19, 2 as the peak creatinine levels, and 3 as the last follow‐up creatinine levels. The median follow‐up was 9 months). (C) Correlation matrix analysis of baseline and last follow‐up creatinine. Note a linear trend especially in cases with baseline creatinine below 2 mg/dl. (D) Kaplan–Meier curve for analysis of graft loss in two divided groups based on baseline serum creatinine of 2 mg/dl
