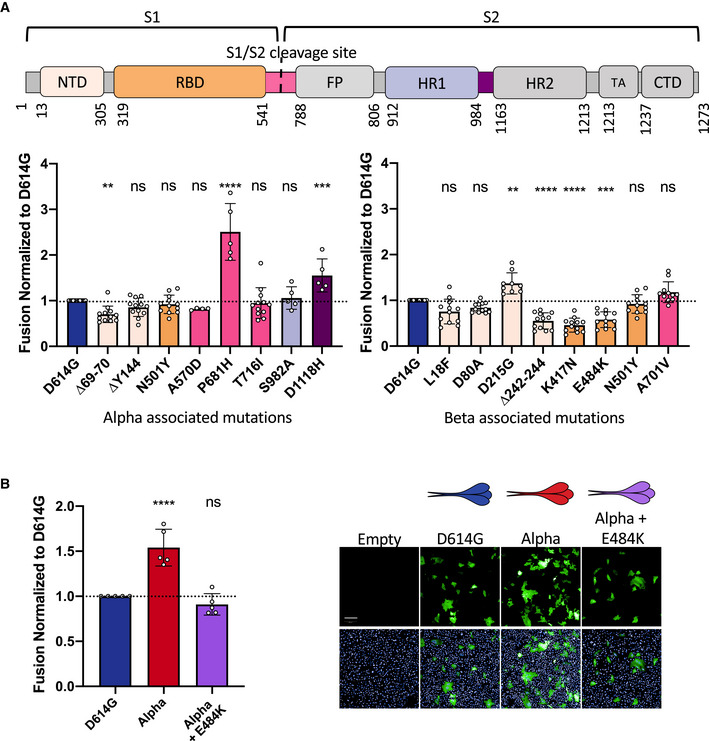
Figure 4. Mutations associated with Alpha and Beta S proteins differentially affect cell–cell fusion.

- Top Panel: Schematic representation of the S protein color‐coded for the functional regions: N‐terminal domain (NTD), receptor‐binding domain (RBD), fusion peptide (FP), heptad repeat 1,2 (HR1, HR2), transmembrane anchor (TA), C‐terminal domain (CTD). Bottom left Panel: Vero GFP‐split cells were transfected with S plasmids containing each of the individual mutations associated with Alpha variant in the D614G background. The amount of fusion was quantified at 20 h and normalized to D614G reference plasmid. Bottom right Panel: Quantified fusion for each of the individual S protein mutations associated with the Beta variant. Color code of each mutation corresponds to S protein functional regions represented in the schematic on the Top Panel. Data set for N501Y and D614G reference mutations are duplicated between bottom left and bottom right panels for presentation as these mutations are common to both variants.
- Left Panel: Quantified fusion of the Alpha + E484K variant S protein normalized to D614G S. Right Panel: Representative images of fusion at 20 h. Scale bar: 200 µm. Top and bottom are the same images with and without Hoechst channel.
Data information: Data are mean ± SD of at least four independent experiments. Top and bottom are the same images with and without Hoechst channel. Statistical analysis: statistics for both left and right panels of A were conducted together. One‐way ANOVA compared with D614G reference, ns: non‐significant, **P < 0.01, ***P < 0.001, ****P < 0.0001.
