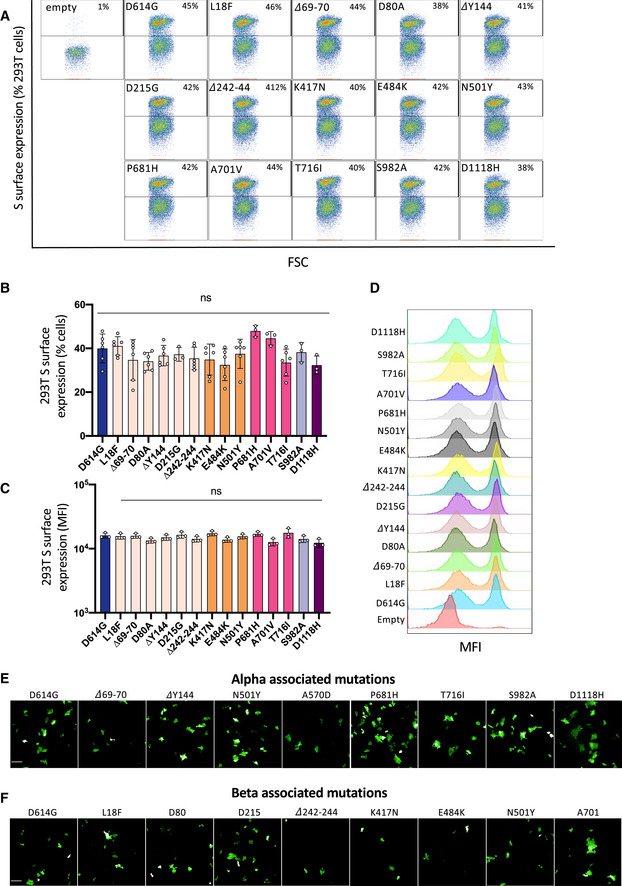
Figure EV4. SARS‐CoV‐2 variant S protein‐associated mutations are expressed equally at the cell surface.

- Representative FAC plots of percent of cells expressing each mutant S protein at the surface.
- Quantification of percent of cells expressing each S protein at the surface.
- Quantification of median florescent intensity (MFI) of the mutant S protein at the cell surface.
- Representative histograms of MFI of each mutant S protein.
- Representative images of Vero GFP‐split cells 20 h after transfection with each Alpha variant‐associated mutant S protein, GFP‐Split (Green). Scale bars: 200 µm.
- Representative images of Vero GFP‐split cells 20 h after transfection with each Beta variant‐associated mutant S protein. Scale bars: 200 µm.
Data information: Data are mean ± SD of at least three independent experiments. Statistical analysis: one‐way ANOVA compared with D614G reference, ns: non‐significant.
