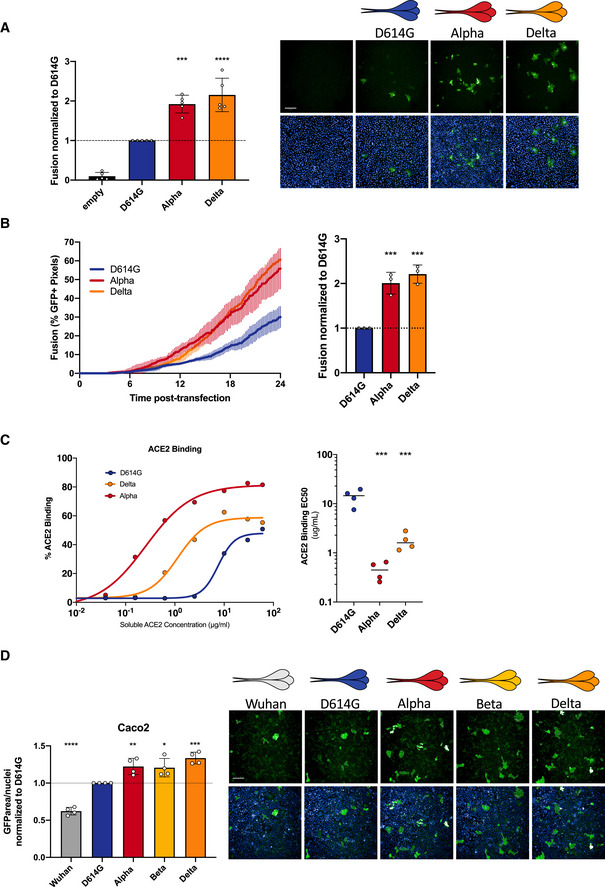
Figure 6. Delta SARS‐CoV‐2 S protein induces more syncytia formation and binds more to ACE2 than D614G.

- Vero GFP‐split cells were transfected with variant S proteins and imaged 18 h post‐transfection. Left Panel: Fusion was quantified by GFP area/number of nuclei and normalized to D614G for each of the transfected variant S proteins. Right Panel: Representative images of Vero GFP‐split cells 18 h post‐transfection, GFP (green), and Hoechst (blue). Top and bottom are the same images with and without Hoechst channel. Scale bars: 200 µm.
- Left Panel: Quantification of Delta S protein‐mediated fusion in Vero GFP‐split cells by video microscopy. Results are mean ± SD from three fields per condition from one representative experiment. Right Panel: Fusion quantification of three independent video microscopy experiments, 20 h post‐transfection, normalized to D614G.
- 293T cells were transfected S proteins with each variant‐associated mutation for 24 h and stained with biotinylated ACE2 and fluorescent streptavidin before analysis by flow cytometry. Left Panel: Representative ACE2 binding dilution curves for the Delta variant in relation to Alpha and D614G. Right Panel: EC50 values (concentration of ACE2 needed for 50% binding) for Alpha for the Delta variant.
- Caco2 GFP‐split cells were transfected with variant S proteins and imaged 18 h post‐transfection. Left Panel: Fusion was quantified by GFP area/ number of nuclei and normalized to D614G for each of the transfected variant S proteins. Right Panel: Representative images of Caco2 GFP‐split cells 18 h post‐transfection, GFP (green), and Hoechst (blue). Top and bottom are the same images with and without Hoechst channel. Scale bars: 200 µm.
Data information: Data are mean ± SD of at least three independent experiments. Statistical analysis: one‐way ANOVA compared with D614G reference, *P < 0. 05, **P < 0.01, ***P < 0.001, ****P < 0.0001.
