Figure 1.

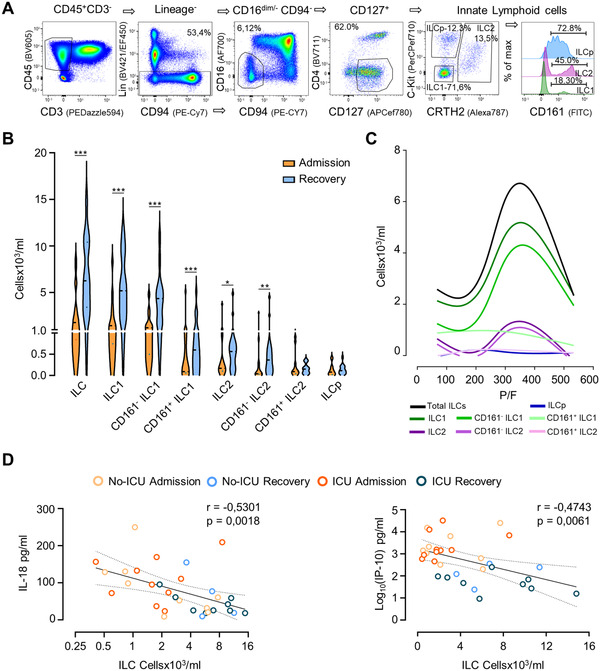
Circulating ILCs counts in COVID‐19 patients. (A) Illustrative whole blood ILC flow cytometry analysis in a representative healthy control showing the sequential manual gating in lymphocytes, CD45+, cells negative for CD3, other lineage markers (CD19, CD14, CD11c, and CD123), CD94, CD16, and CD4, followed by gating on CD127+ cells to define total ILCs; subsequently cKit and CRTH2 were used to define ILCp, ILC2 and ILC1; the histogram illustrates the distinct CD161 expression in these subsets. (B) Comparison of the counts of the main ILC populations at hospital/ICU admission and at recovery; data refer to 20 different patients at admission, with 14 patients also contributing with recovery time points; bars in violin plots refer to median and interquartile range; Wilcoxon matched‐pairs signed ranked test: ***p < 0.001; **p < 0,01; *p < 0.05. (C) Variation of the counts of ILC subsets according to the P/F (Smoothing spline curve fit using data shown in Supporting Information Fig. 2) in the same patients. (D) Correlation of the total ILC counts with IL‐18 and IP‐10 serum levels using Spearman correlation analysis; curve shown with 95% confidence interval (n = 19, with 13 patients contributing with the two time points). The healthy control values for all parameters are listed in Supporting Information Table S2. Samples from patients and controls were processed immediately after blood collection.
