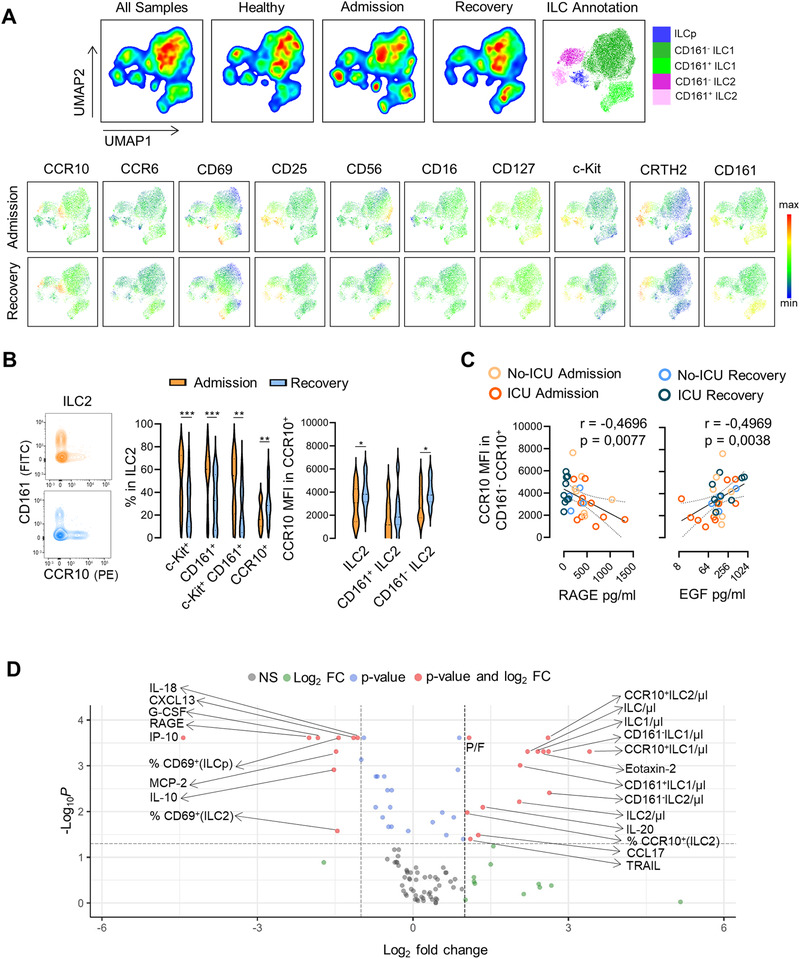
Figure 2.

Expansion of CCR10 expressing ILC2 along with the recovery of COVID‐19. (A) Dimensionality reduction analysis of total ILCs was performed using unsupervised dimensionality reduction analysis (UMAP) algorithm; bi‐dimensional plots of all samples including eight healthy controls and 13 patients with both admission and recovery time points are shown on the top with the annotation of the main ILC populations represented; levels of expression of ILC markers on the grouped patients at admission and recovery are shown in the bottom. (B) Illustrative contour plots of the manual flow cytometry analysis of CD161 and CCR10 within ILC2 at admission and recovery in a representative patient; graphs show the frequency of c‐Kit+, CD161+, c‐Kit+CD161+, and CCR10+ cells within ILC2, as well as the MFI of CCR10 within total CCR10+ILC2, CCR10+CD161+ ILC2, and CCR10+CD161neg ILC2 subsets (n = 14); bars in violin plots refer to median and interquartile range; Wilcoxon matched pairs signed ranked test was used; ***p < 0,001; **p < 0,01; *p < 0,05. (C) Graphs show the correlation of the MFI of CCR10 within CCR10+CD161neg ILC2 with the serum levels of RAGE and EGF using Spearman correlation analysis (n = 18 at admission time point and 13 patients also contributing with recovery time point), curve is shown with the 95% confidence interval. (D) Volcano plot representing a fold change > |2| between admission and recovery of 108 parameters analyzed on the patient group (n = 13); frequencies refer to the gate mentioned in brackets. Patient and healthy control values for all parameters are listed in Supporting Information Table S2. Samples from patients and controls were processed immediately after blood collection.
