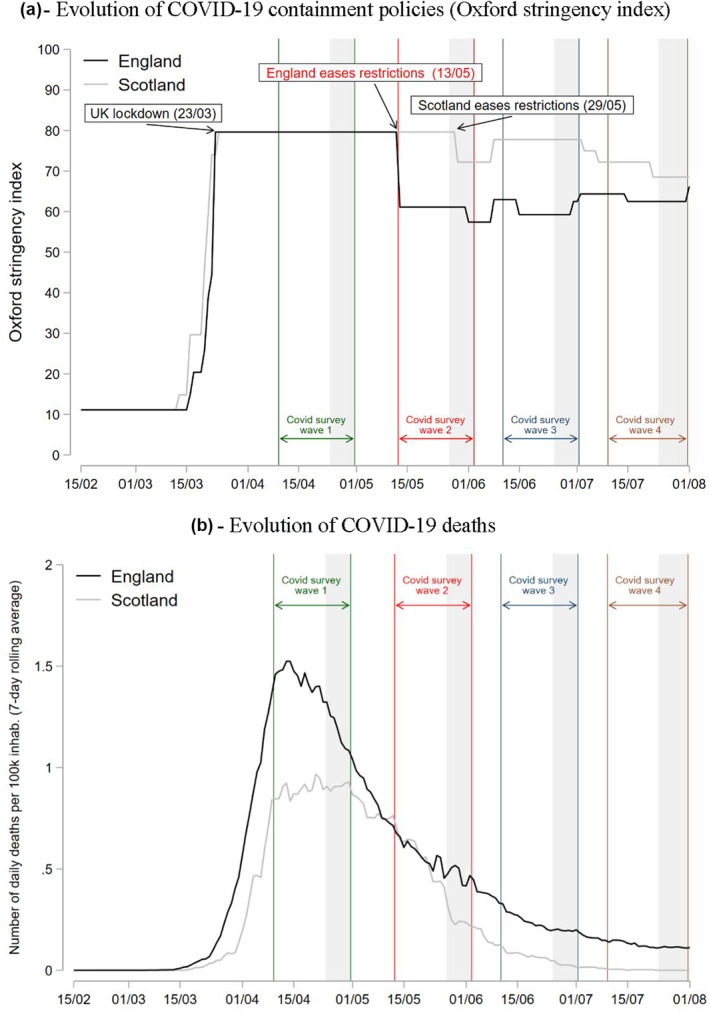
FIGURE 1.

Natural experiment setup. Figure (a) reports the evolution of the Oxford stringency index which measures the strictness of lockdown‐style closure and containment policies that restrict people's behavior (Hale et al., 2020). Shaded areas represent the fieldwork days for each UK Household Longitudinal Study survey wave. The areas between the colorful vertical lines represent the reference period for each survey wave regarding the mental health questions. Mental health questions were framed as how the respondent was feeling “over the last few weeks”. Then, we assumed a reference period of two weeks prior to answering the survey, so that if for wave Covid 2 the fieldwork dates were between May 27 and June 02, then the reference period would be May 13–June 02. Important to note that most of the interviews in Scotland at Wave 2 (68%) were carried out during the days May 17 and 28 when the region was still at the maximum level of restrictions. Figure (b) reports the 7‐day rolling average of COVID‐19 deaths based on the publish date. Data source: UK government (https://coronavirus.data.gov.uk/details/download). (a) Evolution of COVID‐19 containment policies (Oxford stringency index); (b) Evolution of COVID‐19 deaths
