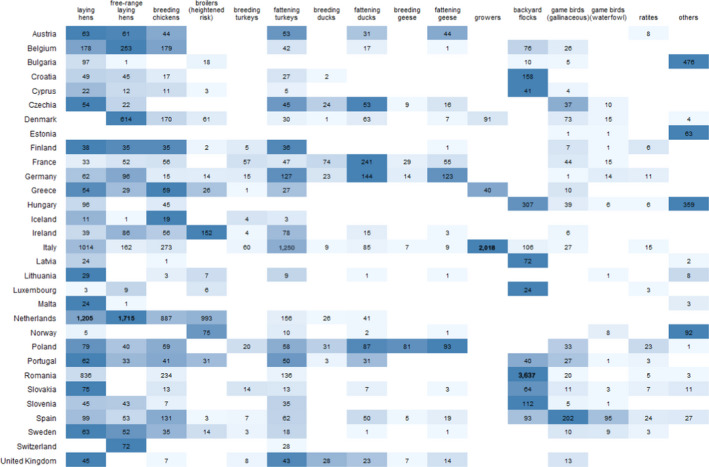
Figure 1.

Total number of PEs sampled, presented by RC and poultry category, according to 16 poultry categories. The colours are used to indicate the poultry categories with the smallest (lightest blue shade) to the largest (darkest blue shade) number of PEs sampled within a given RC
