Figure 3.

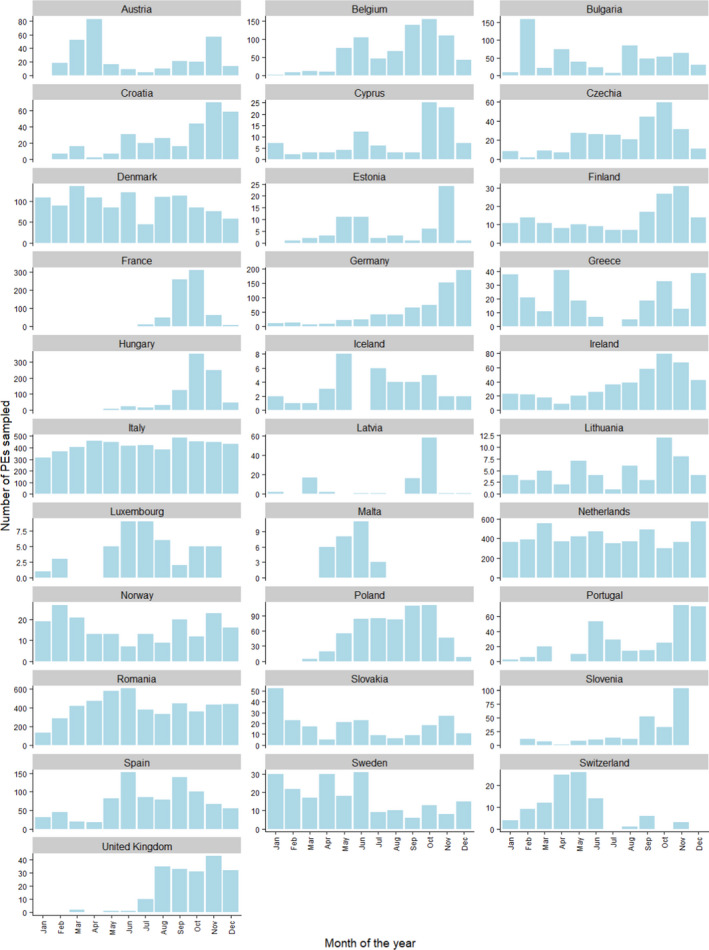
Monthly number of PEs sampled in 2020, presented by RC. Note that the scale of the vertical axes is specific to each country

Monthly number of PEs sampled in 2020, presented by RC. Note that the scale of the vertical axes is specific to each country