
Figure F.1.
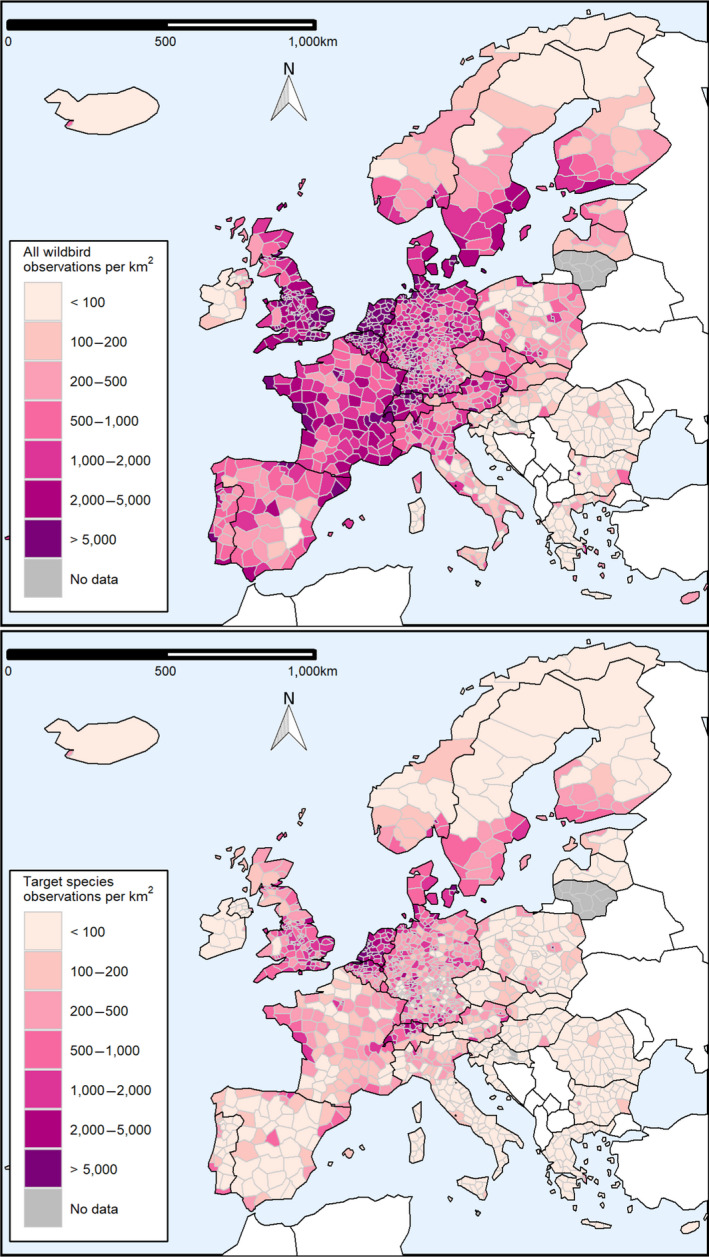
Density of wild bird observations for 2020 by NUTS3 region, as per data provided by the EuroBirdPortal project. The density of observations was estimated as the total number of observations in the NUTS3 region divided by the surface of the area. The upper map shows all bird species, while the lower map is restricted to species from the EFSA target list