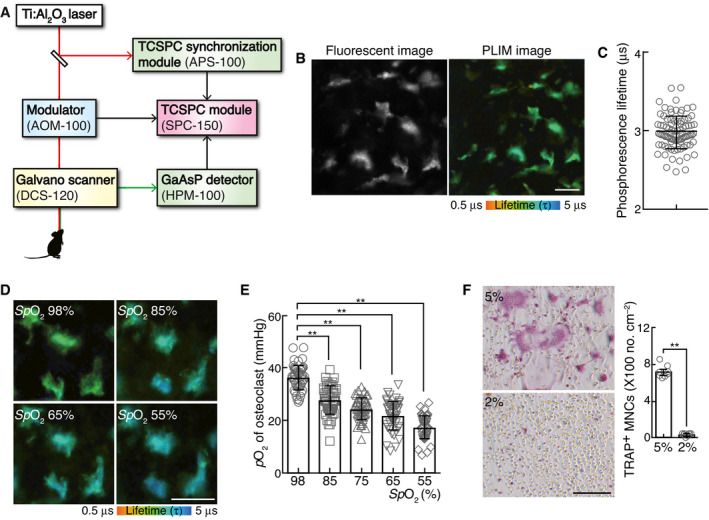
Figure 1. Measurement of passive physiological range of oxygen tension (pO2) of osteoclasts.

-
ASchematic diagram of the two‐photon intravital imaging and 2PLIM.
-
BRepresentative intravital image of calvarial bone marrow of Tcirg1EGFP/+ male mice treated with BTPDM1 showing osteoclasts (left, EGFP fluorescence) and 2PLIM image for pO2 changes (right, phosphorescence lifetime of BTPDM1). Scale bar, 20 μm.
-
CPhosphorescence lifetime in each osteoclast of calvarial bone marrow of mice upon exposure to ambient air (n = 91 from six mice). Data denote mean ± s.e.m.
-
D, EChange in pO2 of osteoclasts in the mice upon exposure to various concentrations of oxygen from 21% to 14% pO2. Magnified PLIM images of osteoclasts under different peripheral oxygen saturations (SpO2, D). The pO2 of each osteoclast in these mice was plotted (E, n = 47 from three mice for each SpO2). Scale bar, 20 μm. Data denote mean ± s.e.m. **P < 0.01 (ANOVA).
-
FEffect of physioxia (5% pO2) or physiological hypoxia (2% pO2) on osteoclastogenesis. TRAP‐stained cells (left panel) and the number of TRAP‐positive cells with more than three nuclei (right). Scale bar, 100 μm. Data denote mean ± s.e.m. **P < 0.01 (n = 8 biological replicates; t‐test).
