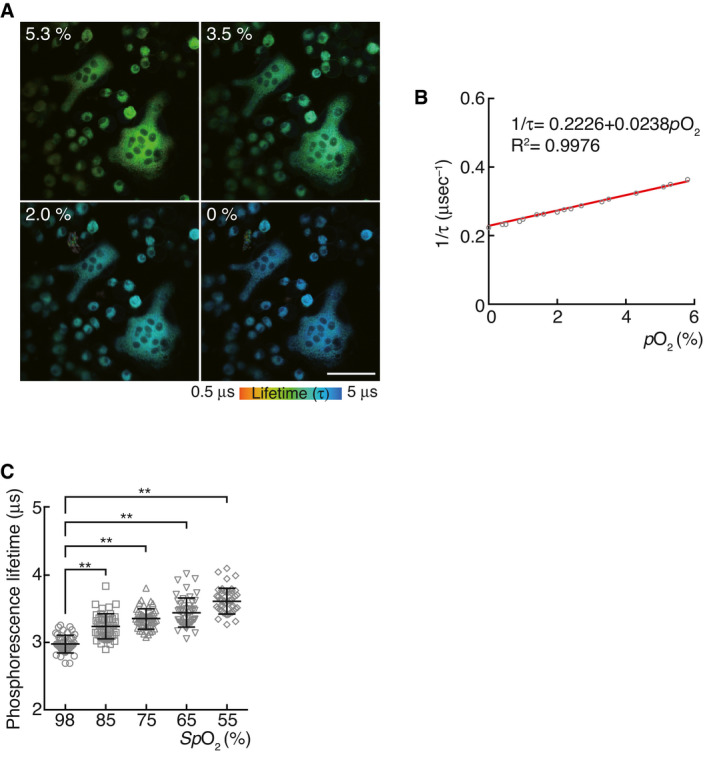
Figure EV1. Reciprocal plot of phosphorescence lifetime and oxygen concentration.

-
APLIM images of in vitro‐cultured osteoclasts under different conditions of oxygen concentration. Scale, 50 μm.
-
BThe phosphorescence quenching due to dissolved oxygen in solution can be examined by the Stern–Volmer equation. The approximate line was constructed by a straight‐line approximation, and an approximation formula and the coefficient of determination are shown.
-
CPhosphorescence lifetime in each osteoclast of the calvarial bone marrow of mice upon inhalation of normal (21% pO2) and hypoxic (14% pO2) air. The phosphorescence lifetime of each osteoclast was plotted (right, n = 47 from three mice for each SpO2). Data denote mean ± s.e.m. **P < 0.01 (ANOVA).
