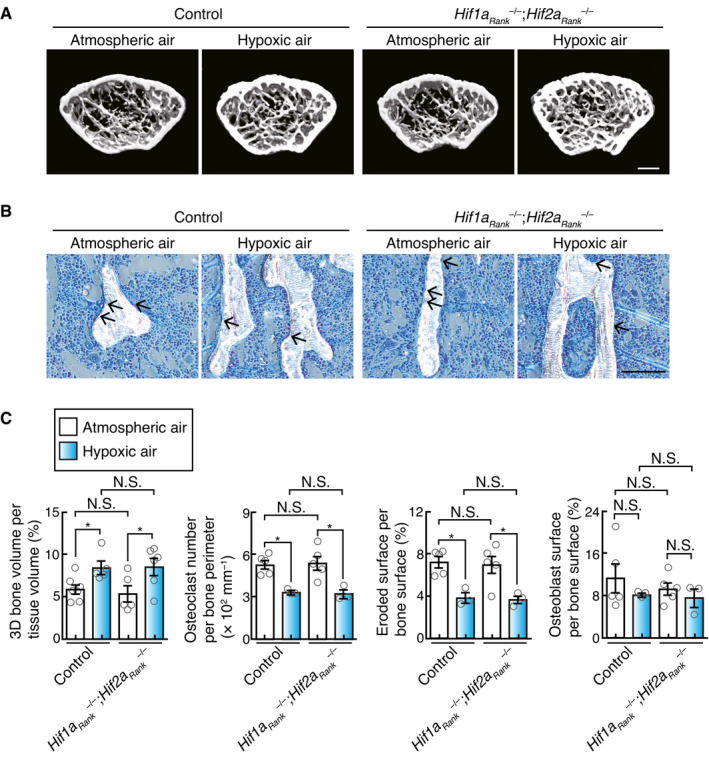
Figure 2. Effect of oxygen deprivation on bone metabolism.

-
AμCT analysis of the femurs of 10‐week‐old male mice upon exposure to low oxygen concentration (14% pO2, n = 5) or ambient air (n = 7), and of 10‐week‐old Hif1aRank –/–; Hif2aRank –/– male mice upon exposure to low oxygen concentration (14% pO2, n = 6) or ambient air (n = 5) for 10 days (axial view of the metaphyseal region). Scale, 0.5 mm.
-
BHistological analysis of the proximal tibias of 10‐week‐old male mice upon exposure to low oxygen concentration (14% pO2) or ambient air for 10 days, and of 10‐week‐old Hif1aRank –/–; Hif2aRank –/– male mice upon exposure to low oxygen concentration (14% pO2) or ambient air (toluidine blue staining [arrow, osteoclasts]). Scale, 100 μm.
-
CParameters for osteoclasts and osteoblasts during bone morphometric analysis of 10‐week‐old male mice under low oxygen concentration (n = 3) or ambient air (n = 5), and 10‐week‐old Hif1aRank –/–; Hif2aRank –/– male under low oxygen concentration (n = 3) or ambient air (n = 5) for 10 days. Data denote mean ± s.e.m. *P < 0.05; NS, not significant (t‐test).
