-
A
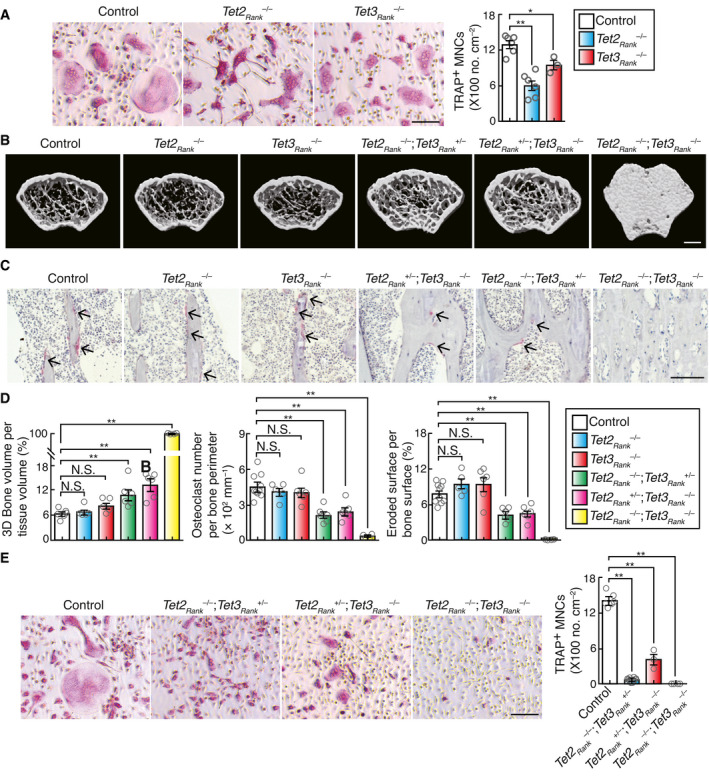
Effect of Tet2 and Tet3 single deficiency on osteoclastogenesis. TRAP‐stained cells (left panel) and the number of TRAP‐positive cells with more than three nuclei (right). Scale bar, 100 μm. Data denote mean ± s.e.m. *P < 0.05; **P < 0.01 (n = 6 (control and Tet2Rank
–/–
) and n = 3 (Tet3aRank
–/–
) biological replicates; ANOVA).
-
B
μCT analysis of the femurs of 10‐week‐old control (n = 6), Tet2Rank
–/–
(n = 5), Tet3Rank
–/–
(n = 5), Tet2Rank
–/–; Tet3aRank
+/–
(n = 6), Tet2Rank
+/–; Tet3aRank
–/–
(n = 6), and Tet2Rank
–/–; Tet3aRank
–/–
(n = 4) male mice (axial view of the metaphyseal region). Scale, 0.5 mm.
-
C
Histological analysis of the proximal tibias of 10‐week‐old control, Tet2Rank
–/–
, Tet3Rank
–/–
, Tet2Rank
–/–; Tet3aRank
+/–
, Tet2Rank
+/–; Tet3aRank
–/–
and Tet2Rank
–/–; Tet3aRank
–/–
male mice (TRAP staining [red, osteoclasts]). Scale, 100 μm.
-
D
Parameters for osteoclastic bone resorption during bone morphometric analysis of 10‐week‐old control (n = 10), Tet2Rank
–/–
(n = 5), Tet3Rank
–/–
(n = 6), Tet2Rank
–/–; Tet3aRank
+/–
(n = 6), Tet2Rank
+/–; Tet3aRank
–/–
(n = 6) and Tet2Rank
–/–; Tet3aRank
–/–
(n = 4) male mice. Data denote mean ± s.e.m. **P < 0.01; NS, not significant (ANOVA).
-
E
Effect of Tet2 and Tet3 double deficiency on osteoclastogenesis. TRAP‐stained cells (left panel) and the number of TRAP‐positive cells with more than three nuclei (right). Scale bar, 100 μm. Data denote mean ± s.e.m. **P < 0.01 (n = 6 (control), n = 10 (Tet2Rank
–/–; Tet3aRank
+/–
), n = 3 (Tet2Rank
+/–; Tet3aRank
–/–
), and n = 4 (Tet2Rank
–/–; Tet3aRank
–/–
) biological replicates; ANOVA).

