-
A
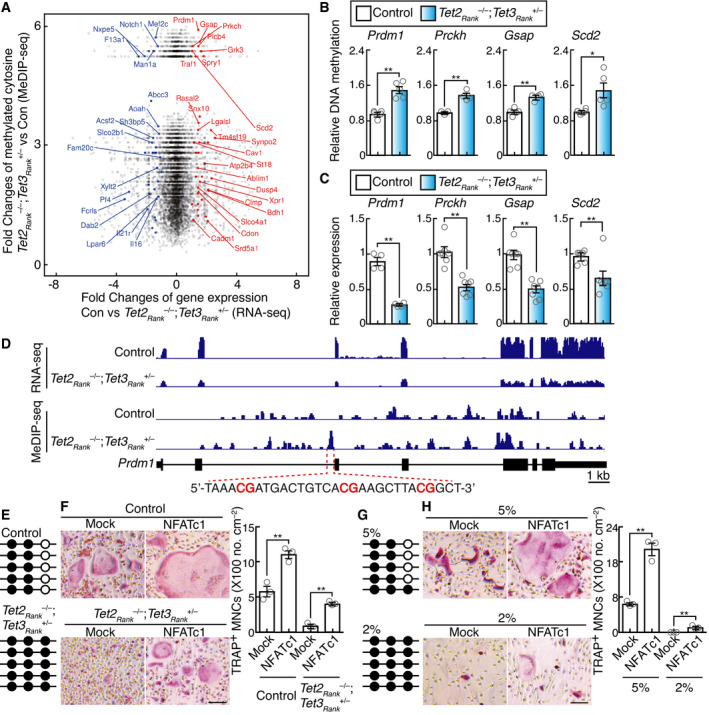
Scatter plot of fold changes in RNA‐seq data and MeDIP‐seq data. The log2 fold changes in RNA‐seq expression between wild‐type control and Tet2Rank
–/–; Tet3aRank
+/–
BMMs stimulated with RANKL for 2 days are shown on the x‐axis, and log2 fold changes in MeDIP‐seq expression (> 0) are shown on the y‐axis. The names of significant genes are labeled (FDR of differential expression analysis < 0.01, p‐value of differential methylated region analysis < 0.01).
-
B
MeDIP‐qPCR analysis to validate regions that are hypermethylated in Tet2Rank
–/–; Tet3aRank
+/–
BMMs stimulated with RANKL for 2 days. Data denote mean ± s.e.m. *P < 0.05; **P < 0.01 (n = 3–5 biological replicates; t‐test).
-
C
Gene expression of TET target candidates in BMMs stimulated with RANKL for 2 days. Data denote mean ± s.e.m. **P < 0.01 (n = 4–7 biological replicates; t‐test).
-
D
Genome browser view of the expression and the methylation site distribution in the Prdm1 gene locus of control and Tet2Rank
–/–; Tet3aRank
+/–
BMMs stimulated with RANKL for 2 days.
-
E
Bisulfate sequencing analysis of selected region of the second intron of the Prdm1 gene in control and Tet2Rank
–/–; Tet3aRank
+/–
BMMs stimulated with RANKL for 2 days.
-
F
Effect of retroviral NFATc1 expression on osteoclastogenesis of control and Tet2Rank
–/–; Tet3aRank
+/–
BMMs stimulated with RANKL for 3 days. TRAP‐stained cells (left panel) and the number of TRAP‐positive cells with more than three nuclei (right). Scale bars, 100 μm. Data denote mean ± s.e.m. **P < 0.01 (n = 3 biological replicates; ANOVA).
-
G
Bisulfate sequencing analysis of the selected region of the second intron of the Prdm1 gene in BMMs stimulated with RANKL and culture under 5% and 2% oxygen for 3 days.
-
H
Effect of retroviral NFATc1 expression on osteoclastogenesis of BMMs stimulated with RANKL and culture under 5% and 2% oxygen for 5 days. Control and Tet2Rank
–/–; Tet3aRank
+/–
BMMs stimulated with RANKL for 3 days. TRAP‐stained cells (left panel) and the number of TRAP‐positive cells with more than three nuclei (right). Scale bars, 100 μm. Data denote mean ± s.e.m. **P < 0.01 (n = 3 biological replicates; ANOVA).

