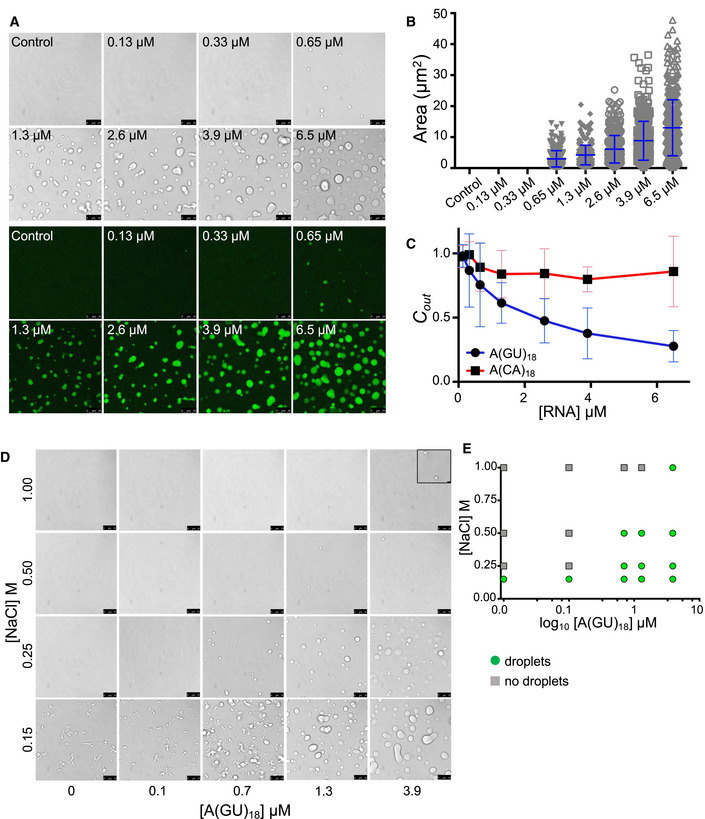
Figure 3. RNA with multiple binding sites modulates TDP‐43 phase properties.

- Liquid droplets observed by brightfield and fluorescence microscopy when Oregon green labeled TDP‐43 (4 μM, 10% labeled protein) was mixed with no RNA control or increasing A(GU)18 RNA concentration at 250 mM of salt. Representative images from three biological replicates using two different protein preparations. Scale bars, 10 μm.
- Area of droplets plotted at different A(GU)18 concentrations. Mean and SD of > 300 droplets from three biological replicates using two different protein preparations.
- TDP‐43 concentration in the light phase measured as a function of A(GU)18 (blue) or A(CA)18 (red) concentration measured by Bradford protein assay. Mean and SD from ≥ 6 biological replicates using two different protein preparations (250 mM of NaCl, 4 µM TDP‐43).
- Phase separation of TDP‐43 (4 μM) at increasing salt concentration without RNA or in the presence of increasing A(GU)18 concentration. Scale bars, 10 μm. Inlay added to top right panel for increased visibility, scale bar 1 μm.
- Phase diagram derived from panel D, denoting either no droplets or droplet formation for each condition.
Source data are available online for this figure.
