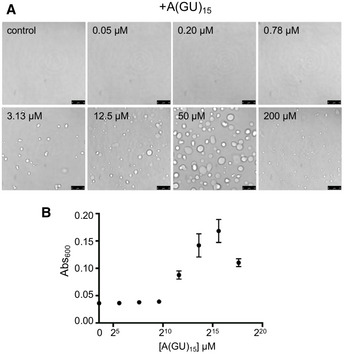
Figure EV3. Increasingly high concentrations of GU repeat RNA drive TDP‐43 out of liquid‐liquid phase separation.

- Droplets observed by brightfield when TDP‐43 was mixed with no RNA control or increasing concentrations of A(GU)15 RNA at 250 mM of NaCl. Representative images for three biological replicates using two protein preparations. Scale bars, 10 μm.
- LLPS measured by turbidity in the same experimental conditions as panel A. Mean and SD from three biological replicates using two different protein preparations.
Source data are available online for this figure.
