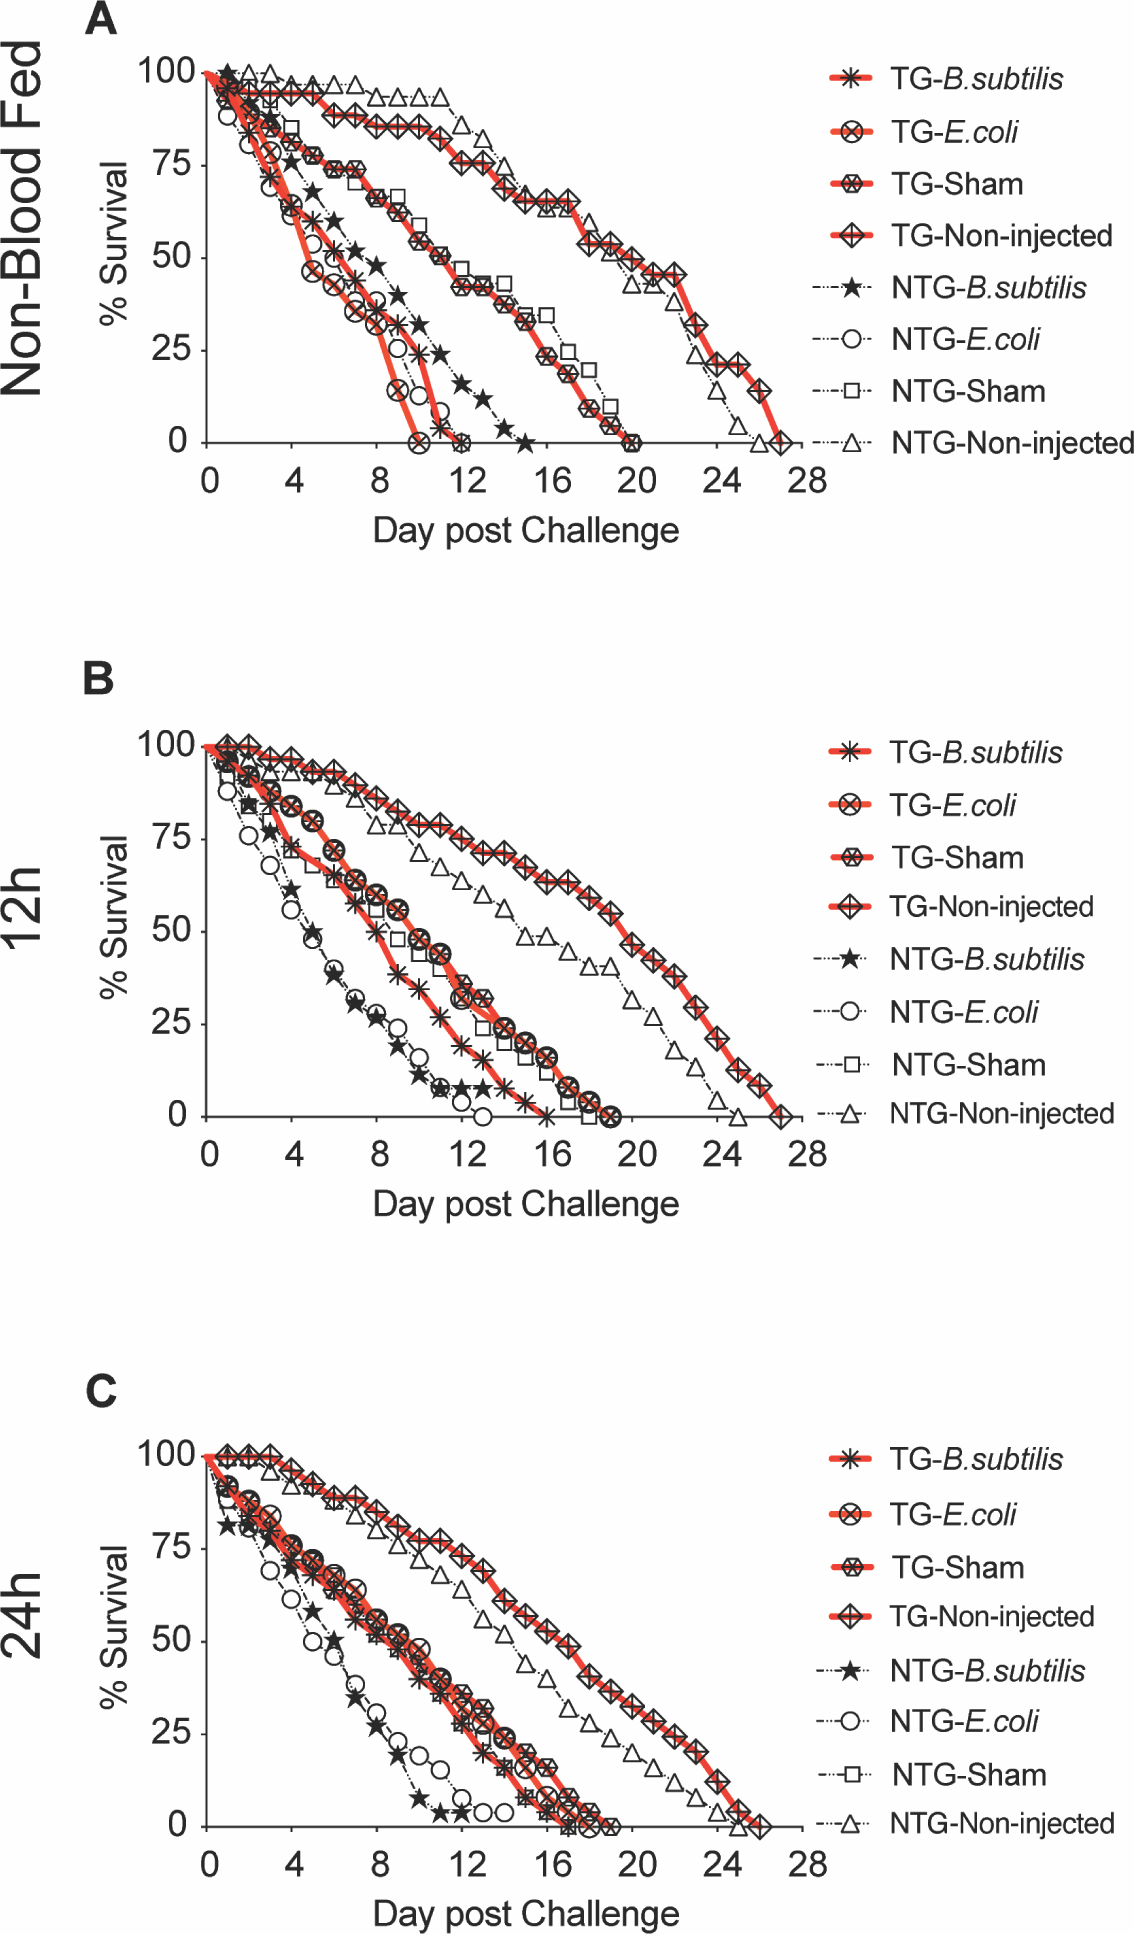
Fig. 5. Survival of TG and NTG mosquitoes following E. coli or B. subtilis infection.

TG and NTG sibling mosquitoes (n=25/treatment) were challenged with either E. coli or B. subtilis and maintained until the final mosquito perished to establish a survival curve. Non-injected and sham injected mosquitoes were used as controls. Mosquitoes were challenged prior to blood feeding, when no transgene was present and 12 and 24 h post-bloodmeal after transgene induction. All treatments are shown on the graphs (A, B and C). This figure is a representative assay and survival curves from two additional biological replicates can be found in supplementary figures (Supp. Figs 6). P values were calculated using the Log-Rank (Mantel-Cox) test and reflect comparisons between matched TG and NTG controls at alpha = 0.05.
