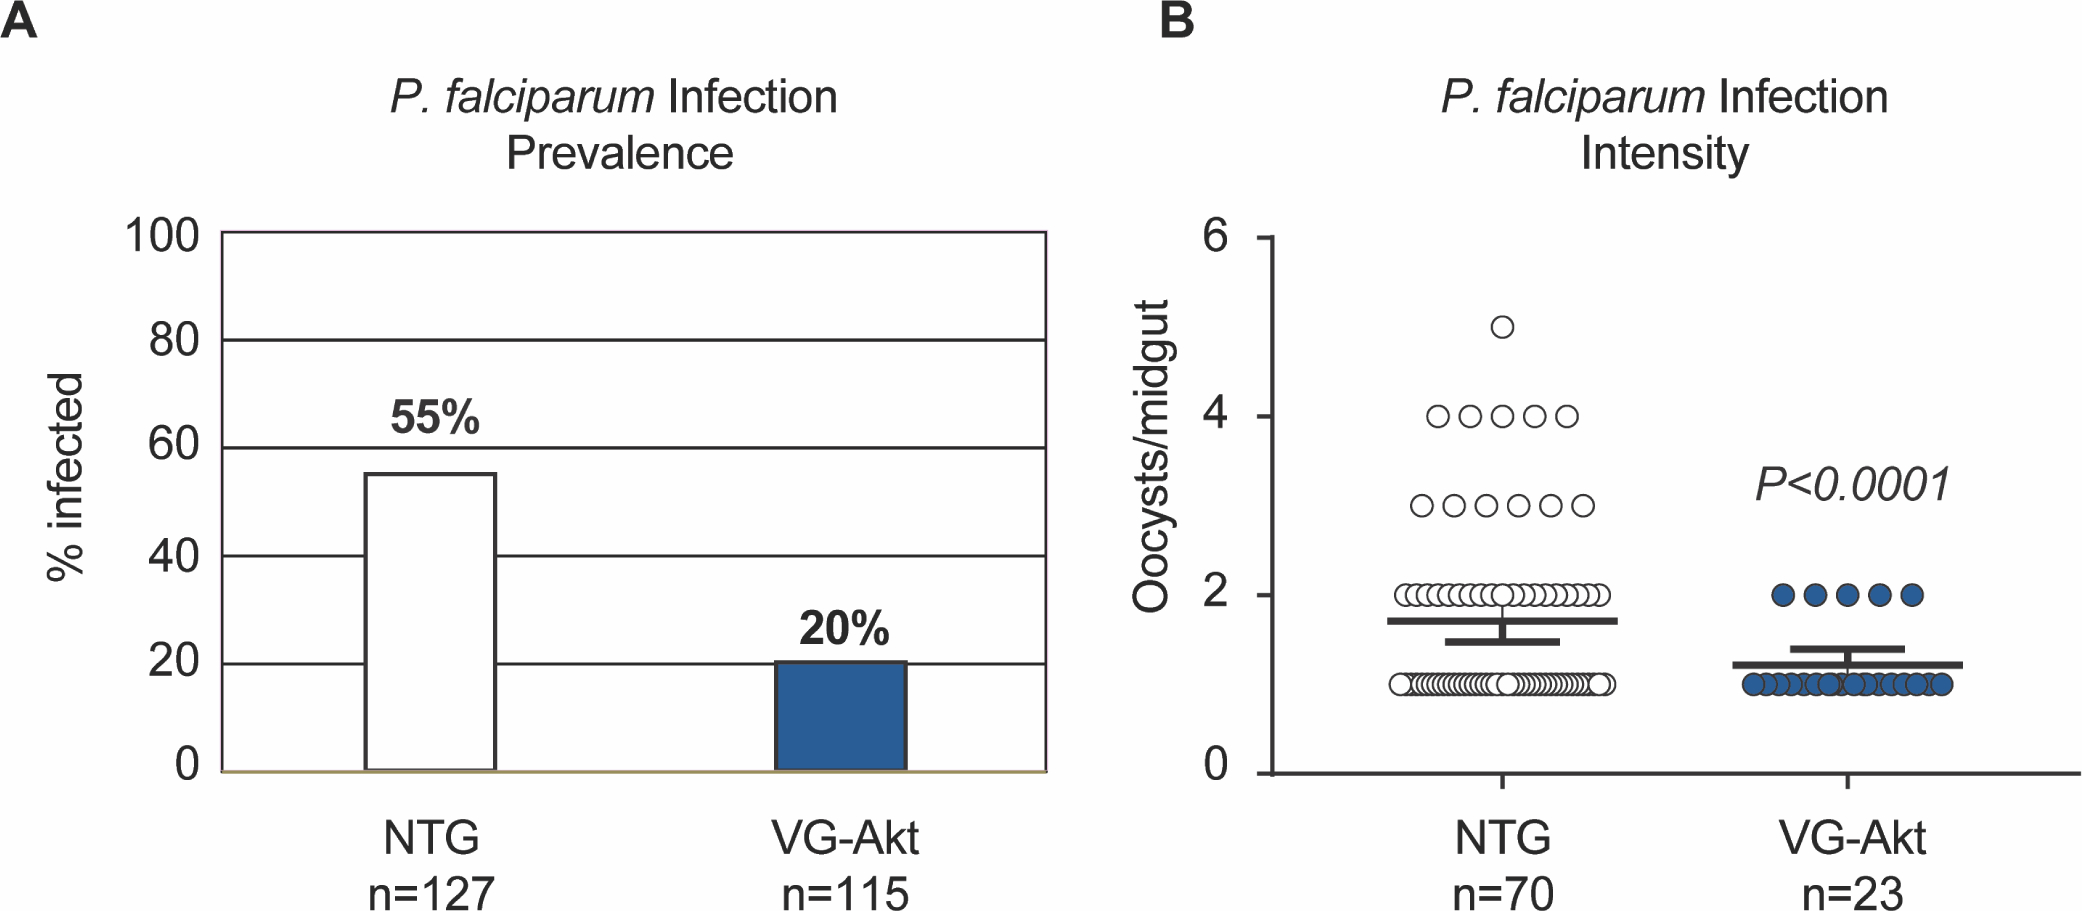
Fig. 6. Resistance of TG and NTG mosquitoes to P. falciparum infection.

TG and NTG mosquitoes were provided with an artificial blood meal containing P. falciparum NF54 gametocytes. Ten days after infection, the midguts were dissected and the numbers of P. falciparum oocysts were counted. A) Infection prevalence was defined as the percentage of mosquitoes that had at least one oocyst in the midgut. B) Infection intensity was defined as the total number of oocysts per midgut. The black line represents the mean number of oocysts per midgut ± SEM. Three replicates were conducted using unique biological cohorts.
