
Fig. 7. Fat body IIS increased AsNOS gene expression in An. stephensi.
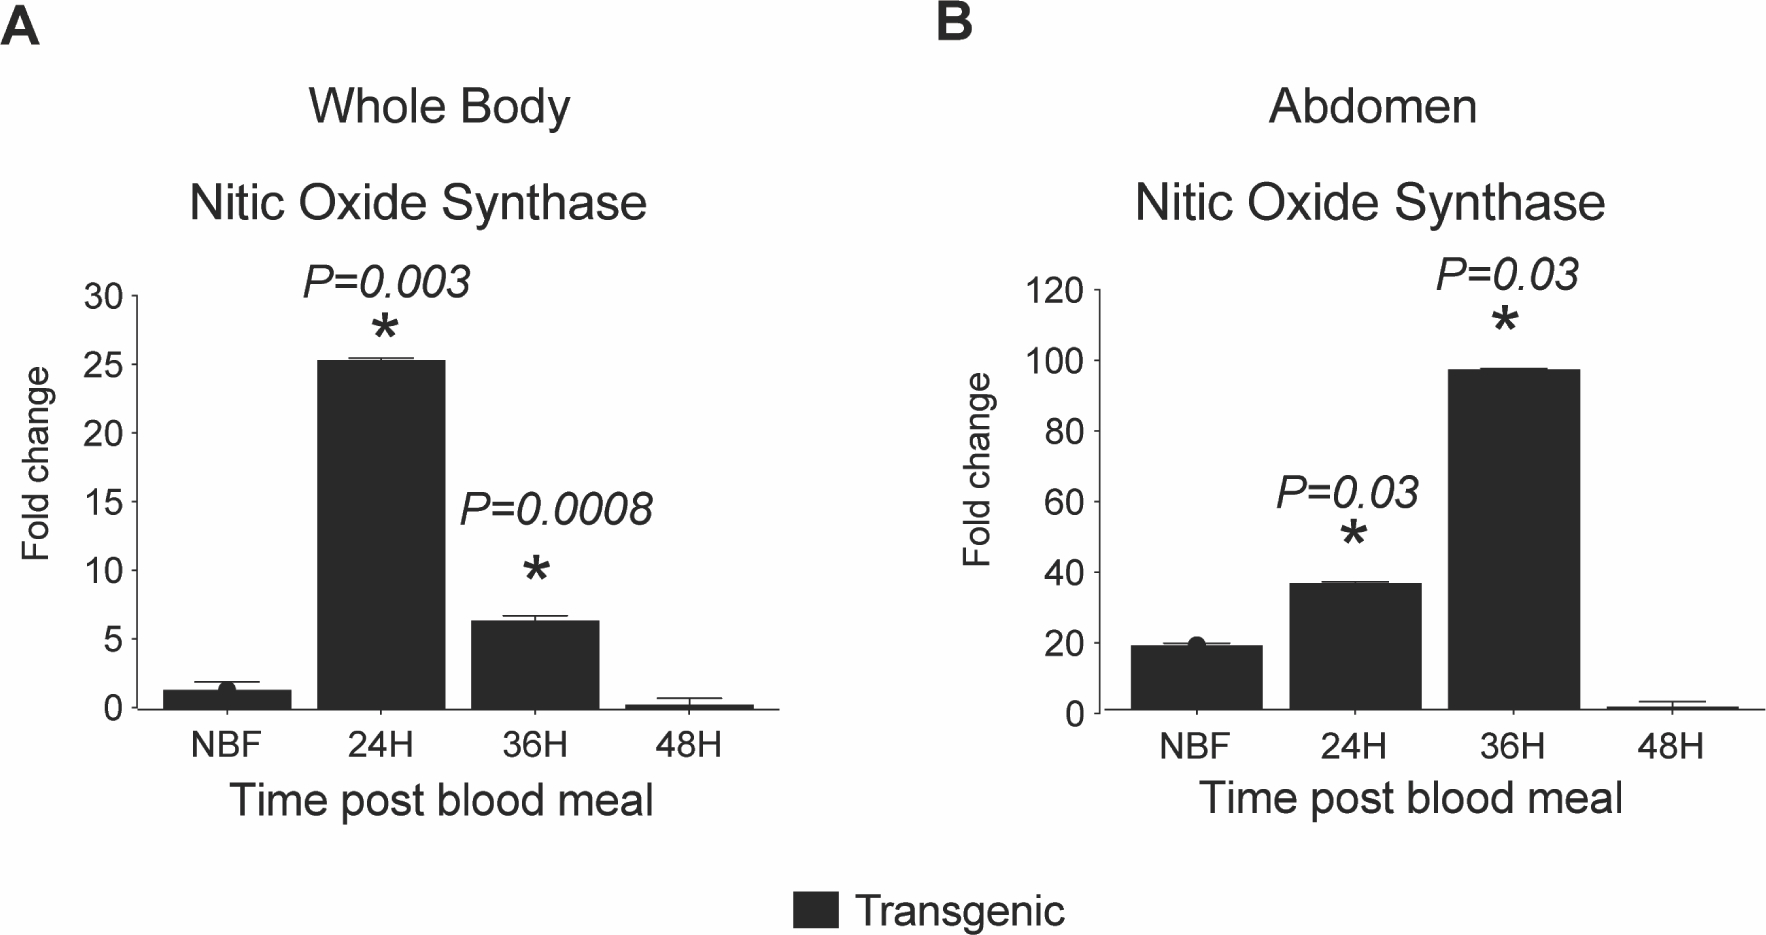
Graph represents the mean (ΔCt) mRNA expression of selected immune genes in RNA samples prepared from a pool of 5: (A) whole body mosquitoes, and (B) abdominal wall (of mosquito abdomen) at different time points for both TG and NTG mosquitoes. Graphs represent means ± SEMs of fold change in the expression of AsNOS for: (C) whole body mosquitoes, and (D) abdominal wall (of mosquito abdomen). Pairwise comparisons of treatments and matched controls were analyzed by Student’s t-test; significant and marginally significant p-values are shown, n = 5.