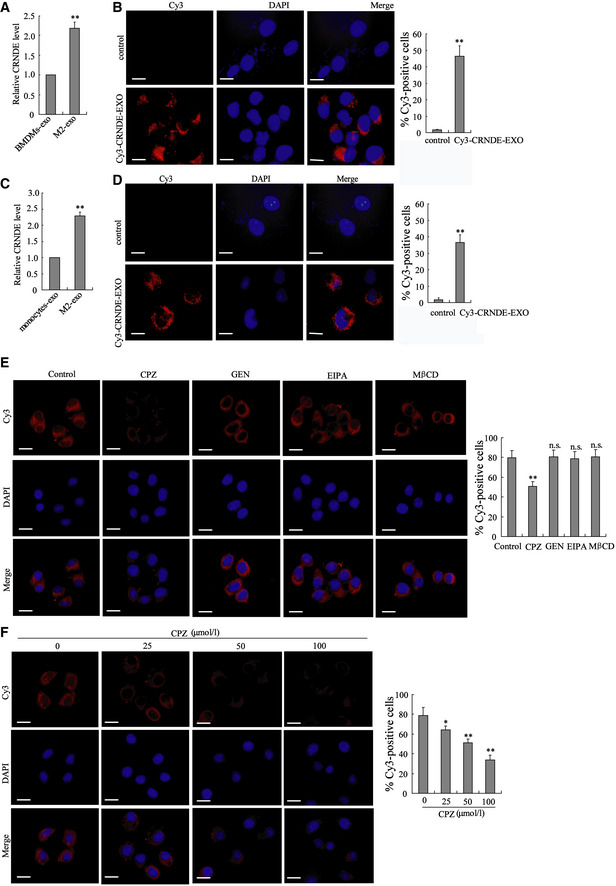
Figure 3. Transport of exosomes might cause upregulation of LncRNA CRNDE in GC cells.

- LncRNA CRNDE expression in MFC cells incubated with BMDMs‐exo or M2‐exo was measured by qRT–PCR. **P < 0.01 vs. BMDMs‐exo.
- BMDM‐polarized M2 macrophages were transfected with Cy3‐labeled CRNDE, and exosomes were isolated from the medium (Cy3‐CRNDE‐EXO). Then, MFC cells were incubated with Cy3‐CRNDE‐EXO. Left: Confocal microscopy was used to detect the Cy3‐labeled CRNDE in MFC cells. The nuclei were stained with DAPI. Scale bar = 20 µm. Right: Flow cytometry was performed to quantitate the Cy3‐positive cells. **P < 0.01 vs. MFC cells incubated with the control EXO.
- LncRNA CRNDE expression in SGC7901 cells incubated with monocytes‐exo or M2‐exo was measured by qRT–PCR. **P < 0.01 vs. monocytes‐exo.
- Monocyte‐polarized M2 macrophages were transfected with Cy3‐labeled CRNDE, and exosomes were isolated from the medium (Cy3‐CRNDE‐EXO). Then, SGC7901 cells were incubated with Cy3‐CRNDE‐EXO. Confocal microscopy was used to detect the Cy3‐labeled CRNDE in SGC7901 cells. The nuclei were stained with DAPI. Scale bar = 20 µm. Right: Flow cytometry was performed to quantitate the Cy3‐positive cells. **P < 0.01 vs. SGC7901 cells incubated with the control EXO.
- SGC7901 cells were incubated with chlorpromazine (CPZ, 50 μM), genistein (GEN, 200 μM), 5‐(n‐ethyl‐n‐isopropyl)‐amiloride (EIPA, 100 μM), or methyl‐β‐cyclodextrin (MβCD, 10 mM), following by the incubation of Cy3‐CRNDE‐EXO. Confocal microscopy was used to detect the Cy3‐labeled CRNDE in SGC7901 cells. The nuclei were stained with DAPI. Right: Flow cytometry was performed to quantitate the Cy3‐positive cells.
- SGC7901 cells were incubated with 0, 25, 50, and 100 μM CPZ, following by the incubation of Cy3‐CRNDE‐EXO. Confocal microscopy was used to detect the Cy3‐labeled CRNDE in SGC7901 cells. The nuclei were stained with DAPI. Right: Flow cytometry was performed to quantitate the Cy3‐positive cells.
Data information: The results shown are from three biological replicates. Data are expressed as mean ± SD. A–D: Student’s t‐test. E and F: one‐way ANOVA.
