-
A
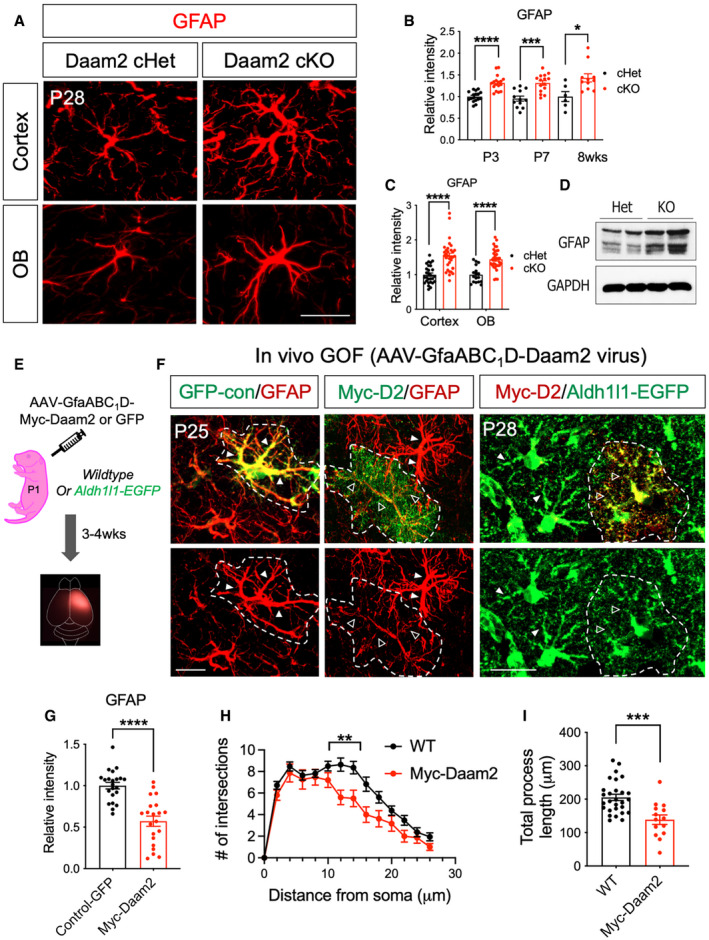
Representative images of GFAP immunostaining in Daam2 cKO mice compared with controls in cortex and OB at P28. Scale bar: 20 μm.
-
B
Quantification of GFAP immunostaining in Daam2 cHet and cKO mice from P3 to adult. Data are presented as mean ± SEM. n = 6–17 images from N = 4–6 mice per each genotype and age. Student's t‐test is used for statistics. *P < 0.05, ***P < 0.001, ****P < 0.0001.
-
C
Quantification of GFAP immunostaining in Daam2 cHet and cKO mice in cortex and OB at P28. Data are presented as mean ± SEM. n = 17–33 images from N = 5 mice per each genotype and age. Student’s t‐test is used for statistics. ****P < 0.0001.
-
D
Western blot analysis showed a significant increase in the amount of GFAP protein in Daam2 KO primary astrocytes. N = 2.
-
E
Schematic of virus injection to overexpress Daam2 in the cortex.
-
F
Overexpression of Daam2 via injection of AAV‐GfaABC1D‐myc‐Daam2 in wild‐type P1 pups revealed reduced GFAP intensity compared with animals injected with control virus (AAV‐GfaABC1D‐GFP). AAV‐GfaABC1D‐myc‐Daam2 was injected into Aldh1l1‐GFP reporter mice for morphological complexity analysis, and infected cells (Myc positive) were compared with non‐infected cells. Dotted white line indicates virus‐infected cells. Filled triangles and empty triangles indicate astrocytic primary branches with the control and reduced level of GFAP or Aldh1l1‐GFP, respectively. Scale bar: 20 μm.
-
G
Quantification of GFAP immunostaining in control virus‐positive cells and Daam2 overexpressing cells. Data are presented as mean ± SEM. n = 22 images from N = 3 mice per genotype. Relative fluorescent intensity was quantified, and Student’s t‐test was used, ****P < 0.0001.
-
H, I
Sholl analysis (H) and quantification of total length (I) of filament with overexpression of Daam2. Data are presented as mean ± SEM. n = 17–32 images from 3 to 4 mice per each. **P < 0.01, ***P < 0.001. Two‐way ANOVA and Student’s t‐test were used for (H) and (I), respectively.

