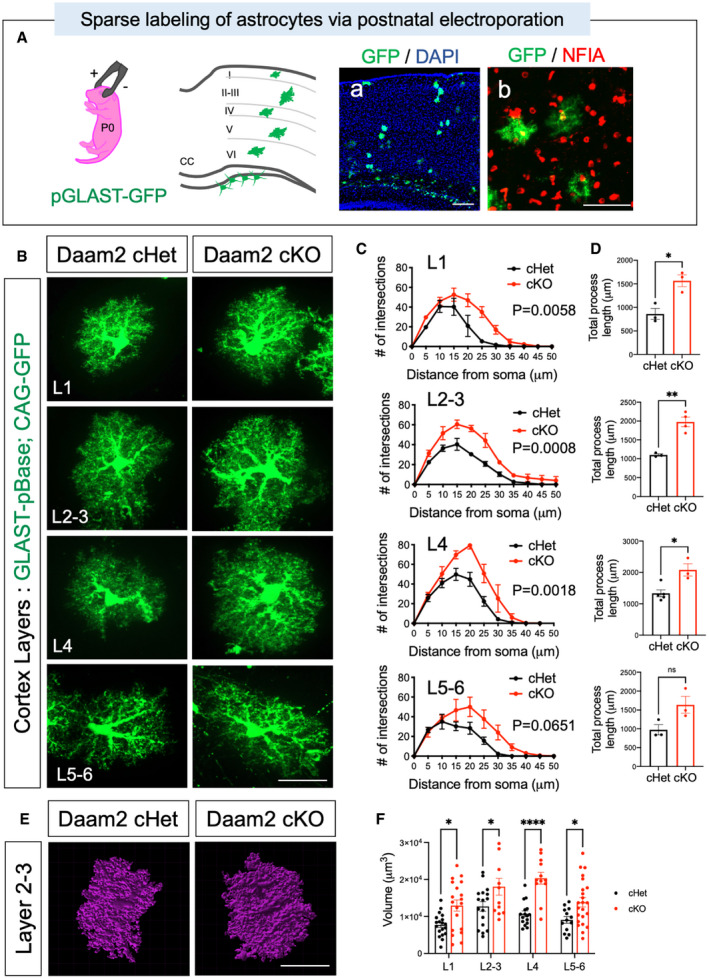
Figure EV2. High‐resolution imaging reveals significant morphological alterations of cortical astrocytes.

-
ASchematic of postnatal electroporation for labeling single astrocytes in cortex. Representative image of GFP‐labeled astrocytes in cortical barrel with DAPI staining and immunostaining with pan‐astrocyte marker, NFIA confirmed GFP‐labeled cells as astrocytes.
-
BMorphology of single cortical astrocytes was visualized and evaluated in each cortical layer using postnatal electroporation of a GFP transgene under control of astrocyte‐specific GLAST promoter‐driven pBase. Scale bar: 20 μm.
-
C, DMorphological alterations in single astrocytes of Daam2 cHet and cKO mice were assessed and quantified as in Fig 1H–K. Data are presented as mean ± SEM. Total n = 13–14 cells from N = 5 mice per genotype were used for analysis. Two‐way ANOVA (C) and Student’s t‐test (D) are used for statistics. *P < 0.05, **P < 0.01.
-
E, FRepresentative images (E) and quantification (F) of 3D volume analysis in astrocytes of Daam2 cHet and cKO mice. Scale bar: 20 μm. (F) Data are presented as mean ± SEM. Total n = 12–23 cells from N = 5 mice per genotype were used for analysis. Two‐way ANOVA is used for statistics. *P < 0.05, ****P < 0.0001.
