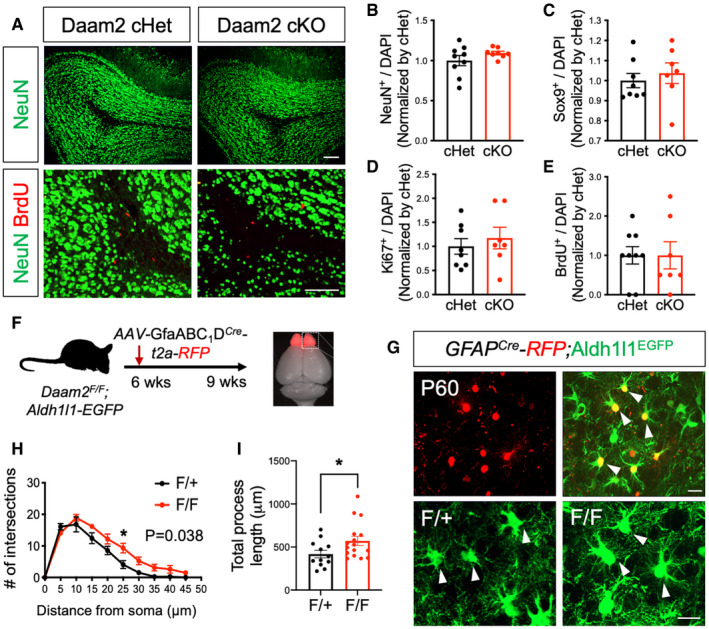
Figure EV3. Temporal loss of Daam2 in adult OB exhibits increased morphological complexity without altering neurogenesis.

-
ARepresentative images of NeuN and BrdU staining in OB of Daam2 cHet and cKO mice. Scale bar: 100 μm.
-
B–ENo significant differences were found in numbers of NeuN+, Sox9+, BrdU+, and Ki67+ cells in OB of Daam2 cHet and Daam2 cKO mice. Data are presented as mean ± SEM. Student’s t‐test was used for statistical comparisons. n = 7–9 images from N = 3 mice per each genotype.
-
FTo visualize morphology of OB astrocytes after development, AAV‐GfaABC1D‐Cre‐t2a‐RFP was injected into 6‐week‐old Daam2F/+ and Daam2F/F mice with Aldh1l1‐EGFP reporter and analyzed three weeks later.
-
G–IVirus‐infected, RFP‐expressing, and Aldh1l1‐EGFP co‐labeled astrocytes (white triangles) were imaged and analyzed for their morphology as in Fig 1. Data are presented as mean ± SEM. n = 12, 16 cells, N = 3 mice per genotype. Two‐way ANOVA (H) and Student’s t‐test (I) were used for statistical comparisons. *P < 0.05. Scale bar: 50 μm.
