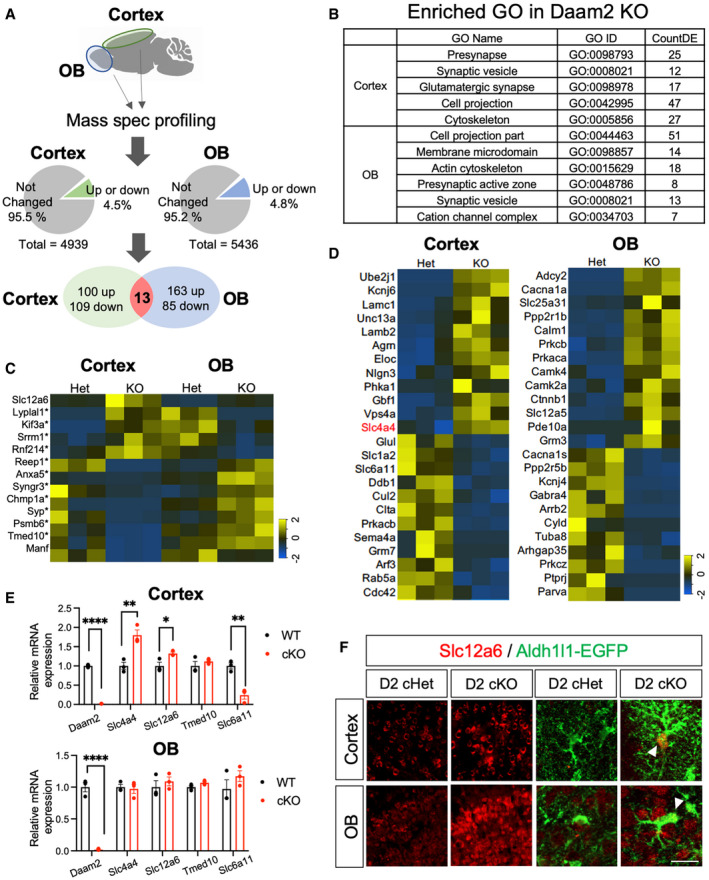
Figure 6. Proteome profiling reveals region‐specific regulation by Daam2.

-
ASchematic of mass‐spec (MS) proteome profiling. Cortex and OB were isolated from Daam2 Het and KO mice (N = 3 each) and digested for peptide library generation. Total numbers of detected and differentially expressed proteins in each brain region are indicated in pie charts. Venn diagram shows differentially expressed genes in each region and genes differentially expressed in both.
-
BGene ontology (GO) analysis of differentially expressed genes in each region.
-
CHeat maps of commonly regulated genes in both regions. Genes differentially regulated in opposite directions in the cortex and OB are marked with *.
-
DHeat maps of uniquely up‐ and downregulated genes in the cortex and OB.
-
E, FqRT–PCR (E) and immunostaining (F) confirm differential expression of genes found in MS profiling. qRT–PCR is repeated as triplicate and is presented as mean ± SEM. *P < 0.05, **P < 0.01, ****P < 0.0001. Student’s t‐test was used. Scale bar: 20 μm.
