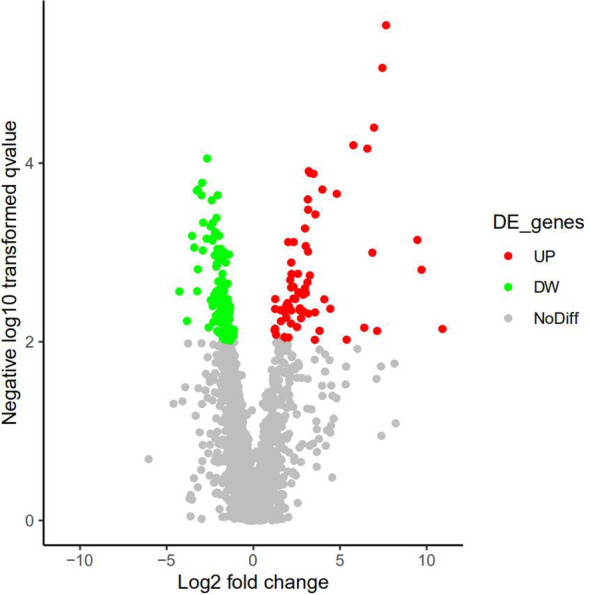
Figure 2.

Active volcano map of proteins, screening criteria of DEPs: P.value<0.05 and Log|logFC|>1. Red dots represent upregulated proteins, and the green dots represent downregulated proteins. Gray dots mean these proteins do not satisfy the screening criteria. X-axis represents Log2|FC|, and the y-axis represents -Log10|P-value|.
