Figure 3.

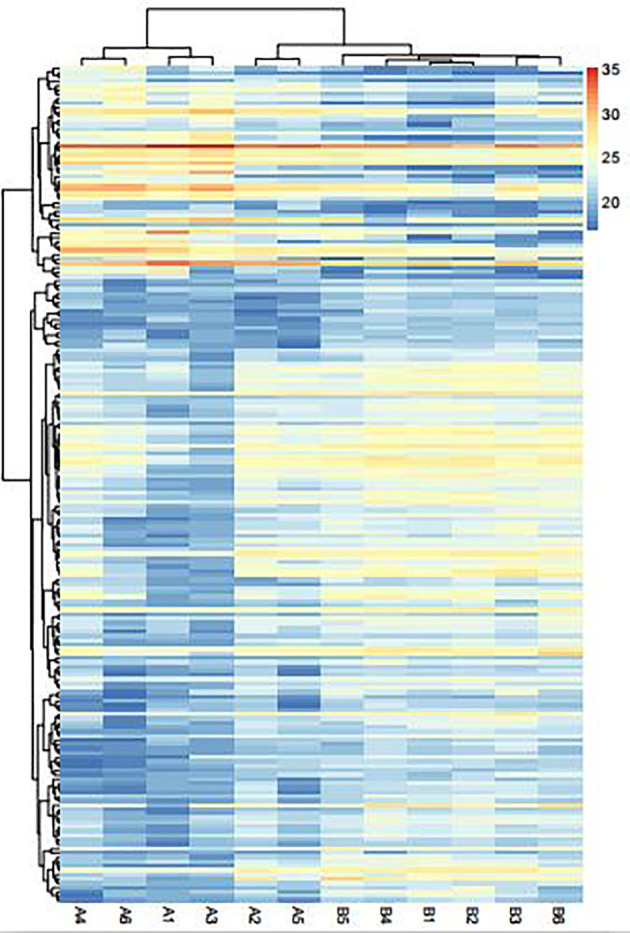
Heat map of the DEPs between AS (A1–A6) and No-AS (B1–B6) groups. Red areas are the upregulated proteins, and the blue areas are the downregulated proteins.

Heat map of the DEPs between AS (A1–A6) and No-AS (B1–B6) groups. Red areas are the upregulated proteins, and the blue areas are the downregulated proteins.