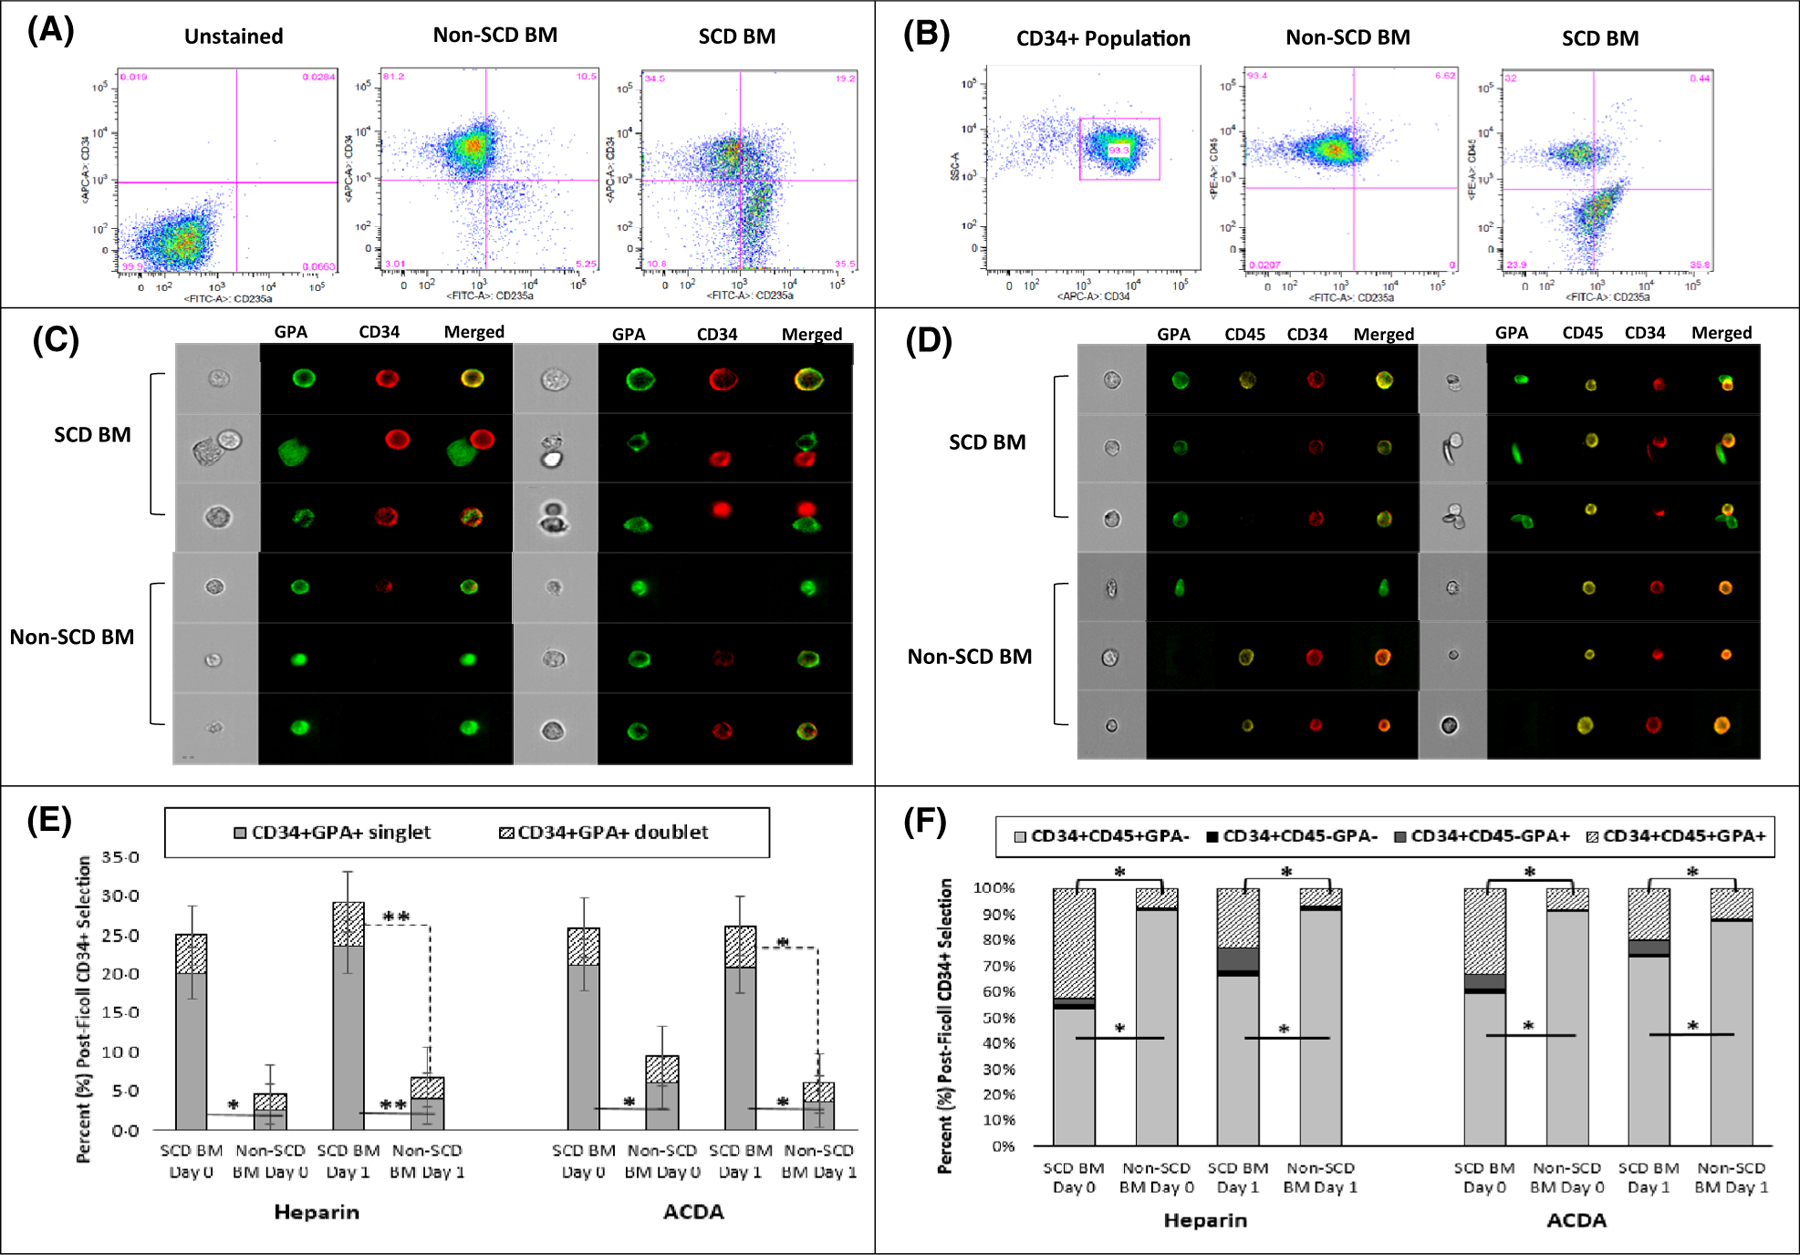
Fig 4.

CD34+ selected HSCs from subjects with SCD are characterized by higher erythroid lineage expression. Conventional and image flow cytometry compared BM derived CD34+-selected HSCs stained with CD34, CD45, and GPA from subjects with SCD compared to healthy volunteers (non-SCD). (A) CD34+-selected HSCs in SCD are characterized by higher GPA expression and red cell contamination. (B) After gating on the CD34+ population, there is a larger and distinct CD34+CD45—GPA+ population in SCD BM compared to non-SCD BM. (C) Image and convention flow cytometry (E) demonstrate significantly more CD34+ and GPA+ co-expression on single HSCs (singlet) in SCD (n = 10) compared to non-SCD BM (n = 5), regardless of anticoagulant or day of processing, in addition to increased aggregates (doublets) of CD34+ HSCs aggregated with GPA+ red cells in SCD marrow that worsen with a delay in processing. (D) Image flow cytometry demonstrates a majority of GPA expression in the subject with SCD is from single cell CD34+CD45+GPA+ and CD34+CD45—GPA+ HSCs in addition to aggregates of CD34+ cells with GPA+ red cells, often sickled red cells. A majority of GPA expression in normal marrow is derived from red cell contamination in the post-Ficoll mononuclear layer and rarely as co-expression on a single cell. (F) Regardless of anticoagulant or processing day, there is a significantly lower percentage of CD34+CD45+GPA— HSCs in SCD marrow (n = 10) compared to non-SCD marrow (n = 5) due to increased percentage of SCD CD34+CD45+ and CD34+CD45— HSCs co-expressing early erythroid lineage. CD235a: GPA; *P < 0·05 **P < 0·01. BM, bone marrow; HSCs, haematopoietic stem cells; GPA, glycophorin A; SCD, sickle cell disease.
