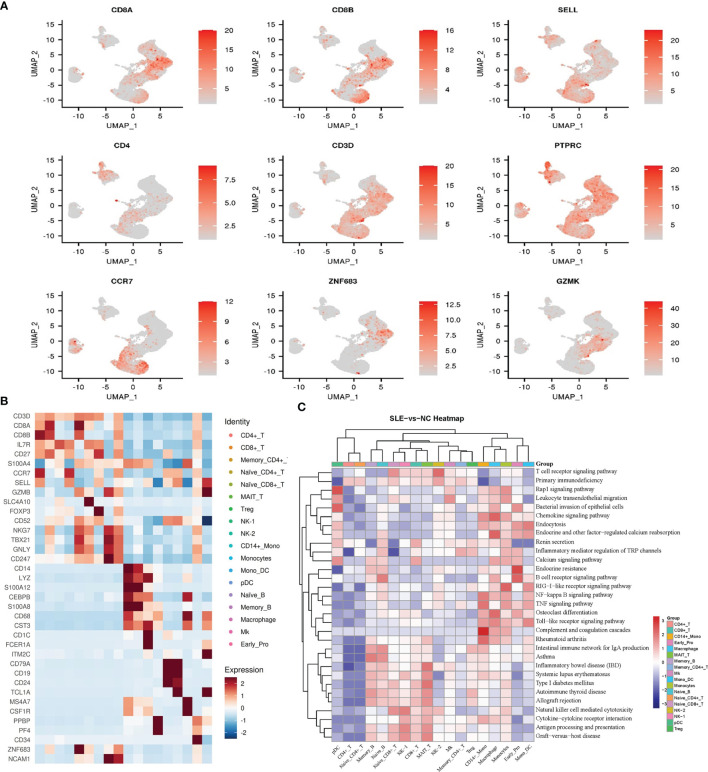
Figure 2.
Cell type identification and functional analysis of differential genes between the AS-PBMC and NC-PBMC. (A) UMAP plots of canonical cell markers used to identify clusters, color-coded for expression levels. (B) Heatmap to show the expression levels of the selected gene markers of each cell type. (C) Pathway enrichment analysis (KEGG) of significantly differential gens between the AS-PBMC and NC-PBMC libraries (p < 0.05). Heatmap expression is the result of Z-score column-wise normalization. The P-value is represented by the color. All P values are less than 0.05. The redder the color, the smaller the P value, indicating that the enrichment was more notable. The white color represents that DEGs of this cell type is not enriched in this signaling pathway.

