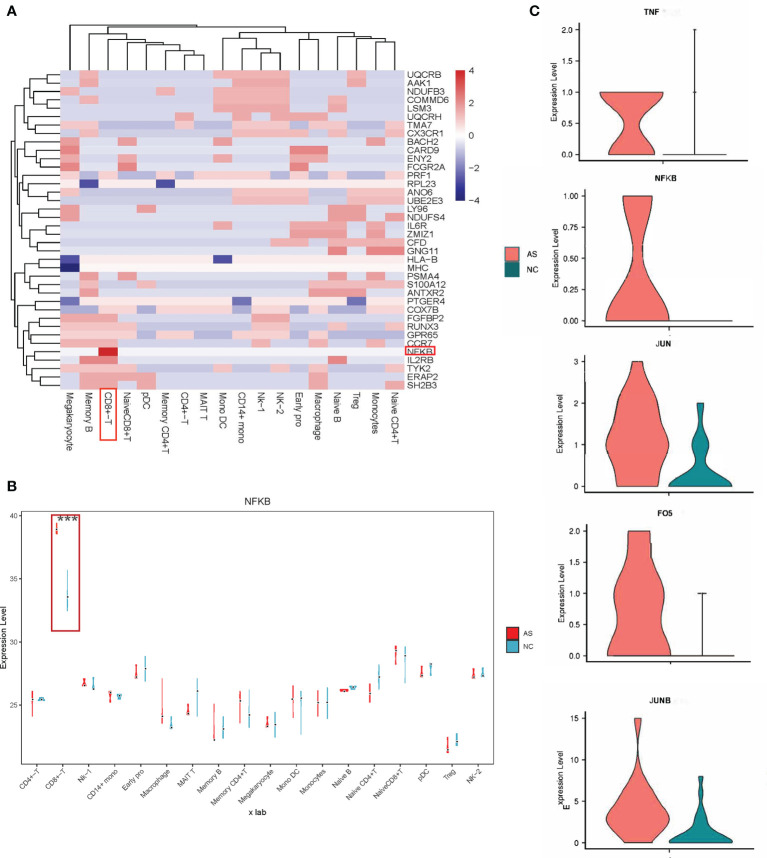
Figure 3.
Relationship between pathogenic genes and specific cell types. (A) Heatmap representing the AS causal genes expression levels in the specific cell type. The scale bar displays fold change values; Fold change value “0” is given for genes which are not DE, statistical significance was taken at P values of less than 0.05 (P < 0.05). and a fold-change criterion (FC>1.2); (B) Violin-box plots for NFKB expression level by cell type, compared to respective controls. The results for AS are shown in red, and those for NC are in green; ***p < 0.001. (C) Violin plots comparing the expression of selected genes (TNF, NFKB, JUN, JUNB, FOS) in CD8+T cells across AS and NC. The results for AS are shown in red, and those for NC are shown in green.

