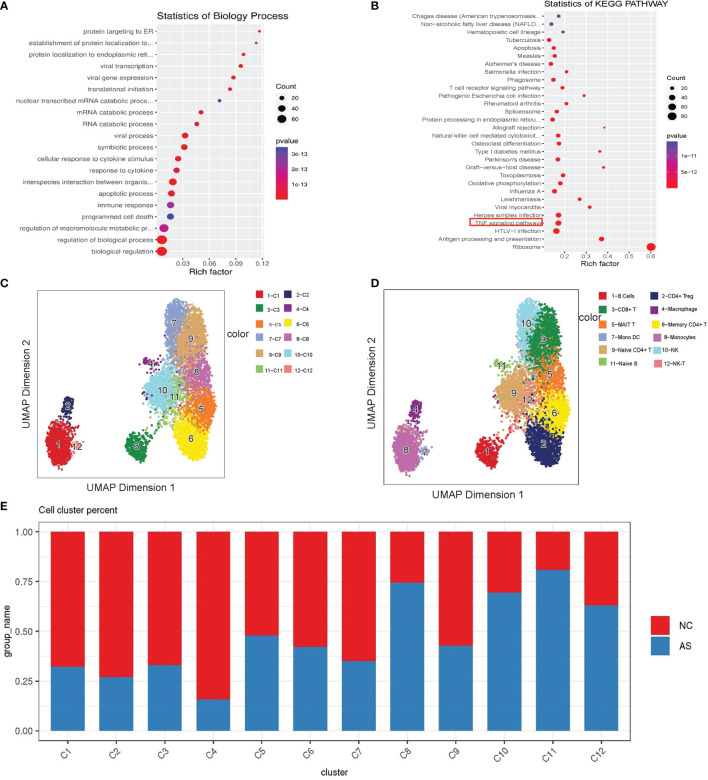
Figure 4.
Single-cell analysis of CD8+T cell. (A) GO term analysis for biological processes of differentially differential genes between the AS-PBMC and NC-PBMC scRNA-seq libraries in CD8 +T cells (p < 0.05); (B) KEGG pathway analysis of differentially differential genes between the AS-PBMC and NC-PBMC scRNA-seq libraries in CD8 +T cells (p <0.05). The red border indicates the TNF signaling pathway; (C) A UMAP plot showing 12clusters through SCATAC-seq; (D) A UMAP plot showing 12 leukocytic clusters corresponding to 12 cell types according to known cell marker genes through SCATAC-seq; (E) Cell abundance in clusters across the AS-PBMC and NC-PBMC libraries.

