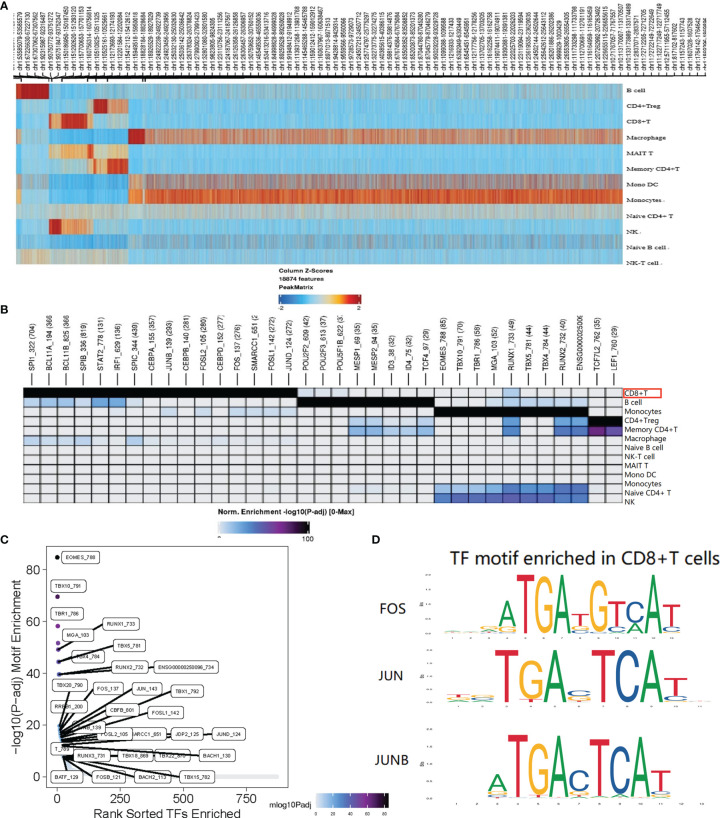
Figure 5.
Single-cell ATAC analysis of CD8+T cell. (A) The heatmap shows the peaks that are specific for each cell type. (B) Different TF motifs in each cluster are specific for each cell type (p < 0.05); The red border indicates the motif associated with genes FOS, JUN, and JUNB; (C) CD8+T cell specific motif highly enriched in the peak; (D) FOS, JUN, and JUNB with differential accessibility between the AS-PBMC and NC-PBMC libraries across CD8+T cell. P values shown in this figure were calculated with ArchR through the difference analysis feature and adjusted using the Benjamini–Hochberg correction for multiple tests.

