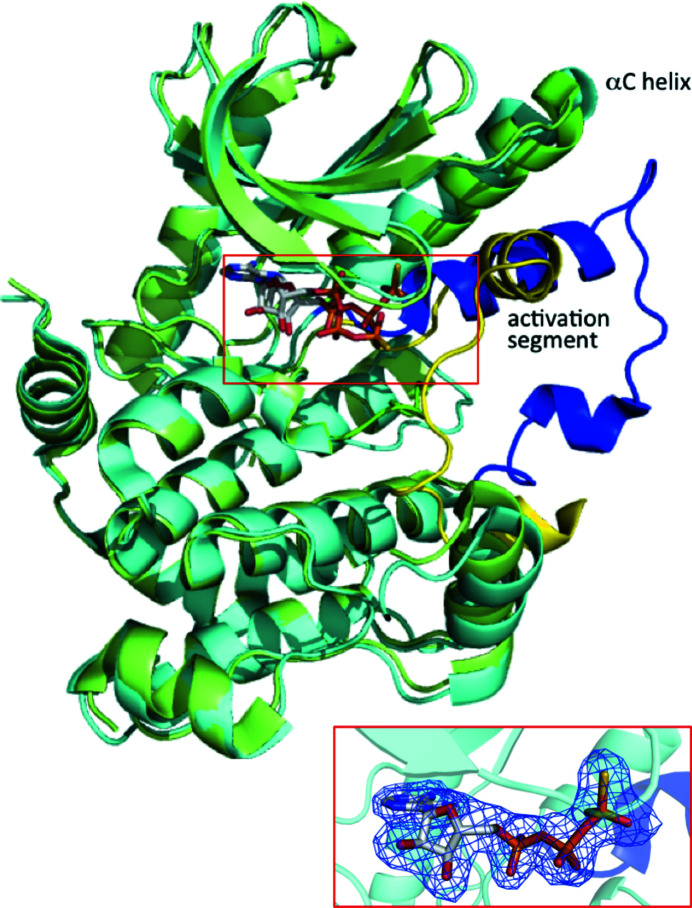
Figure 1.
Superposition of structures of MEK1 adopting the DFG-out conformation (this work; PDB entry 3w8q; cyan) and the DFG-in conformation (PDB entry 3eqd; Fischmann et al., 2009 ▸; green). The Cα atoms of both structures superimpose very well (r.m.s.d. of 1.0 Å) except for the αC helix and activation segment. MEK1 is represented as a ribbon diagram. The activation segments are shown in blue and yellow for the DFG-out and DFG-in conformations, respectively. The ATP-γS molecule is shown as a stick model. The ATP-γS binding site is shown in the box and an enlarged view corresponding to this region including an omit F o − F c map contoured at 3σ for the DFG-out conformation is shown in the inset.

