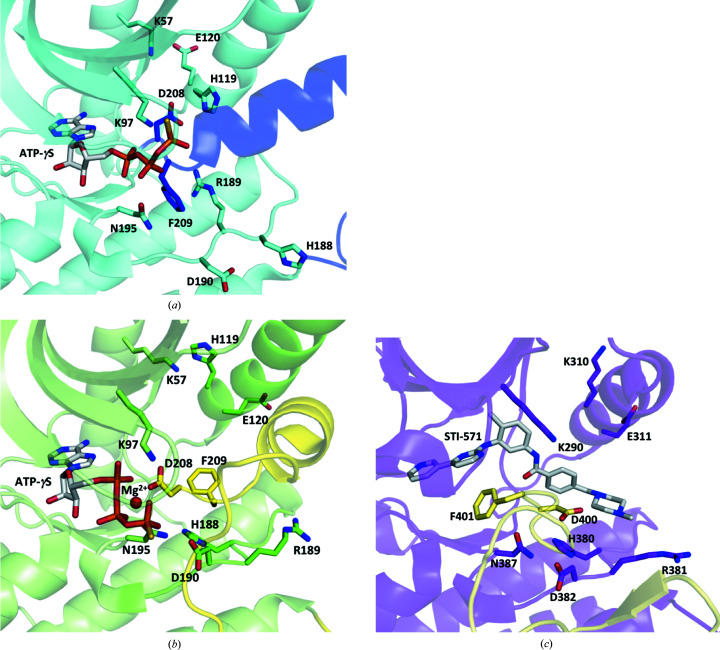
Figure 2.
A structural comparison of the DFG motif and αC helix of (a) MEK1 in the DFG-out conformation (PDB entry 3w8q), (b) MEK1 in the DFG-in conformation (PDB entry 3eqd) and (c) c-Abl in the flipped DFG-out conformation (PDB entry 1opj; Nagar et al., 2003 ▸). The ATP-γS molecule, the STI-571 inhibitor molecule and notable residues involved in structural changes are shown as stick models. The activation segments are shown in blue in (a), yellow in (b) and pale yellow in (c). The Mg2+ ion is indicated as a sphere colored magenta in (b).

